Tutorial 211 | Create a rectangle between 2 times and the highest/lowest price between those times
8 months ago
2
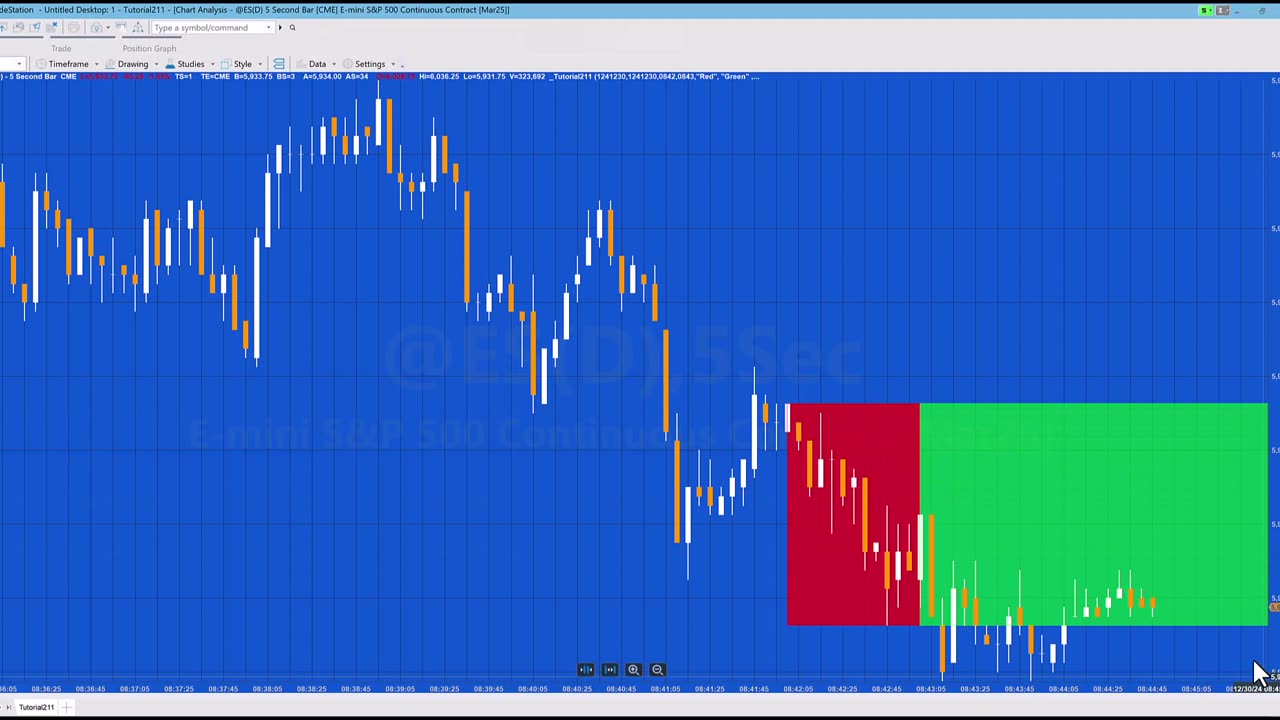
Tutorial 211 explains how to draw a rectangle on a chart between two times with the highs and lows set to be the highest high and the lowest low during the period between the two times. A second rectangle is drawn continuing the first rectangle to the end of the chart. The rectangles are drawn using a method.
The tutorial also shows how to convert dates and time to DateTime format and how to created DateTime points.
The tutorial program is able to draw rectangles for historical times that have already passed as well as future bars.
Loading comments...
-
 10:31
10:31
Dr. Eric Berg
2 hours ago13 Foods You Should Never Buy Organic
27.4K13 -
 15:10
15:10
SB Mowing
1 month agoShe had TEARS OF JOY on her face - An update on Beth
18.6K31 -
 LIVE
LIVE
Lofi Girl
3 years agolofi hip hop radio 📚 - beats to relax/study to
205 watching -
 2:15:26
Nikko Ortiz
2 hours agoLIVE - Trying Rumble Studio!
169K4 -
 9:30
9:30
Sugar Spun Run
5 hours ago $0.86 earnedBlack and White Cookies
83.6K1 -
 2:45
2:45
SLS - Street League Skateboarding
4 days agoManny Santiago's 'THIS IS 40' Part
47.3K2 -
 6:40
6:40
Homesteading Family
5 days agoNever Make Pie Crust From Scratch Again (Do THIS Instead)
39K5 -
 44:20
44:20
Melissa K Norris
3 days ago $0.72 earnedThe Most Overlooked Way to Preserve Food for Months (No Freezer Needed) w/ Sam Knapp
28.2K1 -
 23:00
23:00
Tony Jeffries
6 days agoThe Best & Worst Boxing Training Methods (Ranked by Olympic Boxer)
20.4K -
 44:44
44:44
Scammer Payback
17 days agoCrazy Confrontation with Hacked Scammer Group
44.2K20