Tutorial 211 | Create a rectangle between 2 times and the highest/lowest price between those times
8 months ago
2
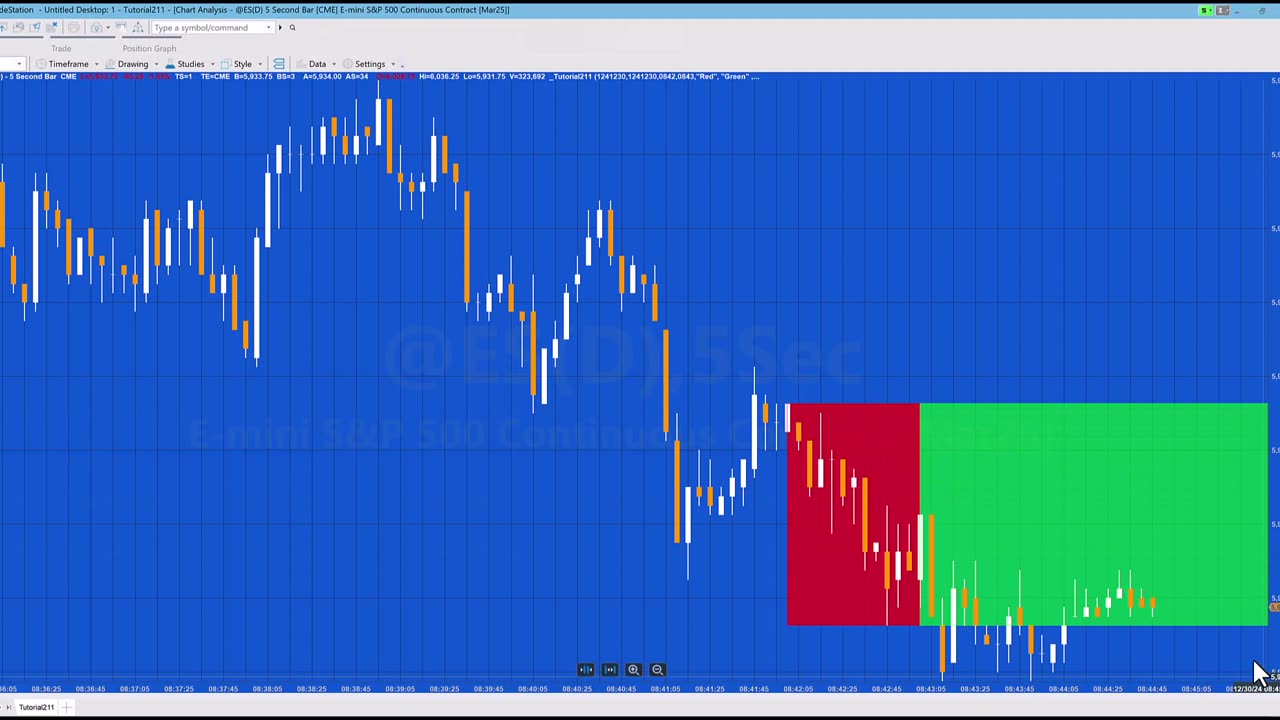
Tutorial 211 explains how to draw a rectangle on a chart between two times with the highs and lows set to be the highest high and the lowest low during the period between the two times. A second rectangle is drawn continuing the first rectangle to the end of the chart. The rectangles are drawn using a method.
The tutorial also shows how to convert dates and time to DateTime format and how to created DateTime points.
The tutorial program is able to draw rectangles for historical times that have already passed as well as future bars.
Loading comments...
-
 1:09:23
The HotSeat
12 hours agoTrump’s Parade = Mocked, China’s Parade = Praised: Leftist Hypocrisy EXPOSED
26.1K33 -
 LIVE
LIVE
Lofi Girl
2 years agoSynthwave Radio 🌌 - beats to chill/game to
202 watching -
 4:34:26
Akademiks
6 hours agoICEMAN EPISODE 3
148K -
 2:04:10
Inverted World Live
9 hours agoThe Robots Are Here | Ep. 103
61.6K15 -
 1:21:53
Man in America
16 hours agoInflation, Debt & War: The 2032 Crash Cycle Is Here—Nations Will FALL w/ Martin Armstrong
58.1K20 -
 1:53:48
Adam Does Movies
15 hours ago $3.13 earnedTalking Movies + Ask Me Anything - LIVE
24.1K2 -
 2:55:43
TimcastIRL
8 hours agoTrump DOJ To Ban Trans People From Owning Guns After Catholic School Shooting | Timcast IRL
187K114 -
 3:21:36
The Quartering
7 hours agoBaldur's Gate 3 First Playthrough!
50K8 -
 6:34:42
Rallied
9 hours ago $9.03 earnedWarzone Solo Challenges
80K2 -
 57:40
57:40
MattMorseTV
9 hours ago $11.99 earned🔴Trump just SHATTERED the RECORD.🔴
57.1K94