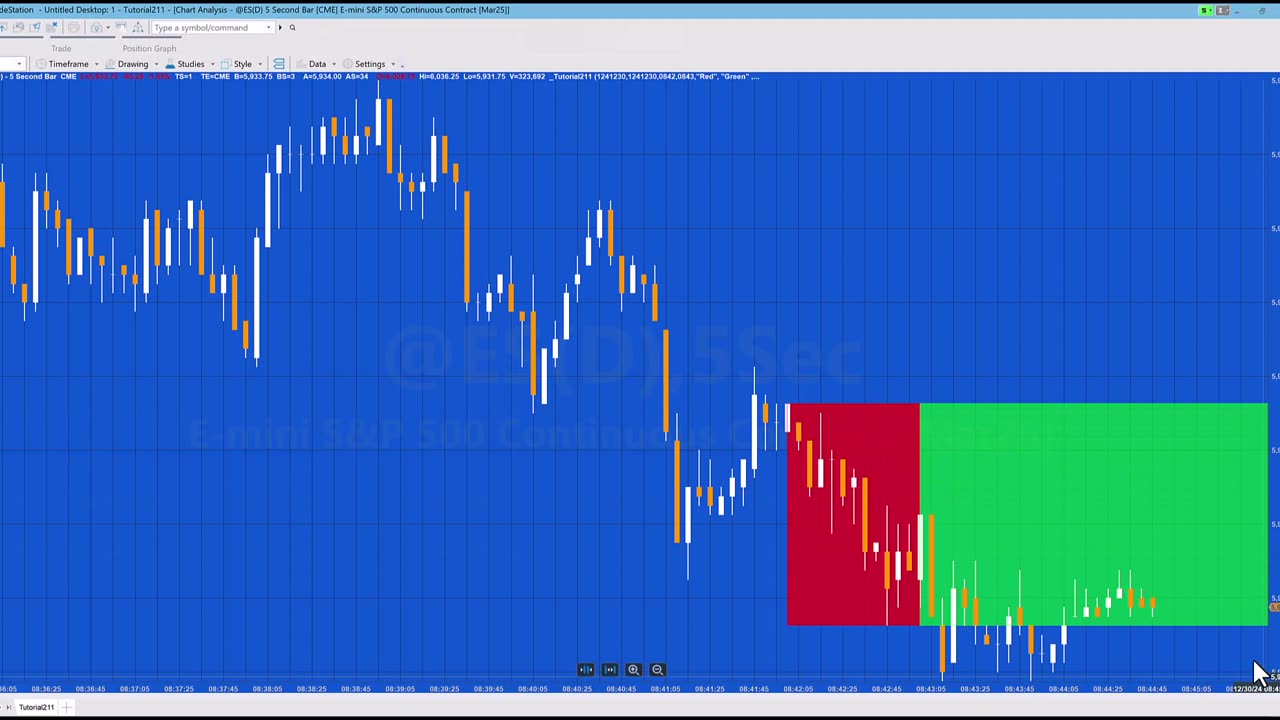
Tutorial 211 | Create a rectangle between 2 times and the highest/lowest price between those times
9 months ago
2
Tutorial 211 explains how to draw a rectangle on a chart between two times with the highs and lows set to be the highest high and the lowest low during the period between the two times. A second rectangle is drawn continuing the first rectangle to the end of the chart. The rectangles are drawn using a method.
The tutorial also shows how to convert dates and time to DateTime format and how to created DateTime points.
The tutorial program is able to draw rectangles for historical times that have already passed as well as future bars.
Loading comments...
-
 56:25
56:25
MentourPilot
1 year agoTITANIC of the Skies! - The Untold Story of Air France 447
15.5K4 -
 LIVE
LIVE
Lofi Girl
2 years agoSynthwave Radio 🌌 - beats to chill/game to
289 watching -
 2:07:47
LFA TV
15 hours agoTHE RUMBLE RUNDOWN LIVE @9AM EST
61.5K5 -
 LIVE
LIVE
I_Came_With_Fire_Podcast
9 hours agoThe Pattern Beneath the World: Nature, The Mark of the Beast, & the Sacred Order
249 watching -
![Mr & Mrs X - [DS] Antifa Are Planning An Insurrection,Trump Has Prepared The Counterinsurgency-EP 11](https://1a-1791.com/video/fwe2/6b/s8/1/k/3/R/p/k3Rpz.0kob-small-Mr-and-Mrs-X-DS-Antifa-Are-.jpg) 49:56
49:56
X22 Report
4 hours agoMr & Mrs X - [DS] Antifa Are Planning An Insurrection,Trump Has Prepared The Counterinsurgency-EP 11
42.5K45 -
 1:08:57
Wendy Bell Radio
8 hours agoPet Talk With The Pet Doc
38.5K26 -
 8:47
8:47
Demons Row
2 days ago $1.45 earnedI Spent $50,000 Building My Dream Harley-Davidson 😳💀 (Learn From My Mistakes)
37.2K9 -
 38:18
38:18
SouthernbelleReacts
22 hours ago $1.53 earnedThey Thought the Secret Was Buried… But I’m Screaming! | Reaction to I Know What You Did Last Summer
28.7K1 -
 29:37
29:37
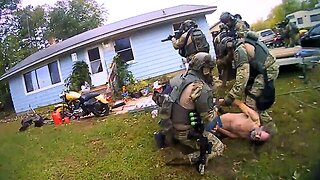
Midwest Crime
1 day ago5 Cops Shot as Minnesota Raid Turns into Chaos
56.8K163 -
 31:08
31:08
mizery
17 days ago $0.52 earnedI Asked 100 Pros To Help Me Go Pro...
13.8K2