Tutorial 211 | Create a rectangle between 2 times and the highest/lowest price between those times
10 months ago
2
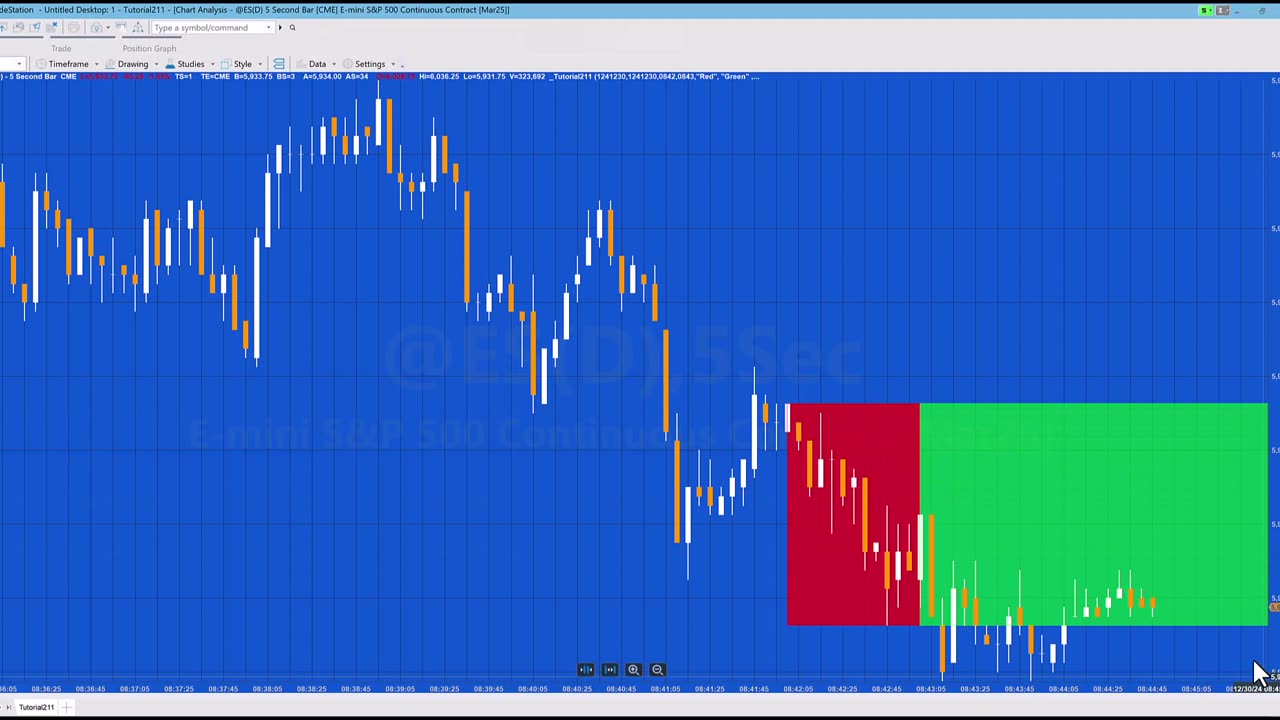
Tutorial 211 explains how to draw a rectangle on a chart between two times with the highs and lows set to be the highest high and the lowest low during the period between the two times. A second rectangle is drawn continuing the first rectangle to the end of the chart. The rectangles are drawn using a method.
The tutorial also shows how to convert dates and time to DateTime format and how to created DateTime points.
The tutorial program is able to draw rectangles for historical times that have already passed as well as future bars.
Loading comments...
-
 LIVE
LIVE
Badlands Media
9 hours agoBadlands Daily Nov. 21, 2025
3,312 watching -
 LIVE
LIVE
Wendy Bell Radio
5 hours agoOh HELL NO
7,354 watching -
 LIVE
LIVE
Major League Fishing
8 days agoLIVE! - Fishing Clash Team Series: Summit Cup - Day 6
200 watching -
 30:49
30:49
MetatronHistory
16 hours agoThe Truth about Women Warriors Based on Facts, Evidence and Sources
5K3 -
 15:17
15:17
IsaacButterfield
6 hours ago $0.22 earnedAustralia’s Most Hated Politician
4.62K2 -
 4:28
4:28
MudandMunitions
12 hours agoSHOT Show 2026 Is Locked In and I’m a Gundie Nominee!
3.27K -
 1:19:44
Chad Prather
19 hours agoWhen God Shakes the Room: Bold Faith in a Fearful World
62.4K42 -
 LIVE
LIVE
LFA TV
13 hours agoLIVE & BREAKING NEWS! | FRIDAY 11/21/25
2,765 watching -
 58:40
58:40
Julie Green Ministries
4 hours agoLIVE WITH JULIE
85.1K136 -
 1:01:10
Crypto Power Hour
12 hours ago $2.34 earnedAnimus Bitcoin Technology
29.2K8