Tutorial 211 | Create a rectangle between 2 times and the highest/lowest price between those times
10 months ago
2
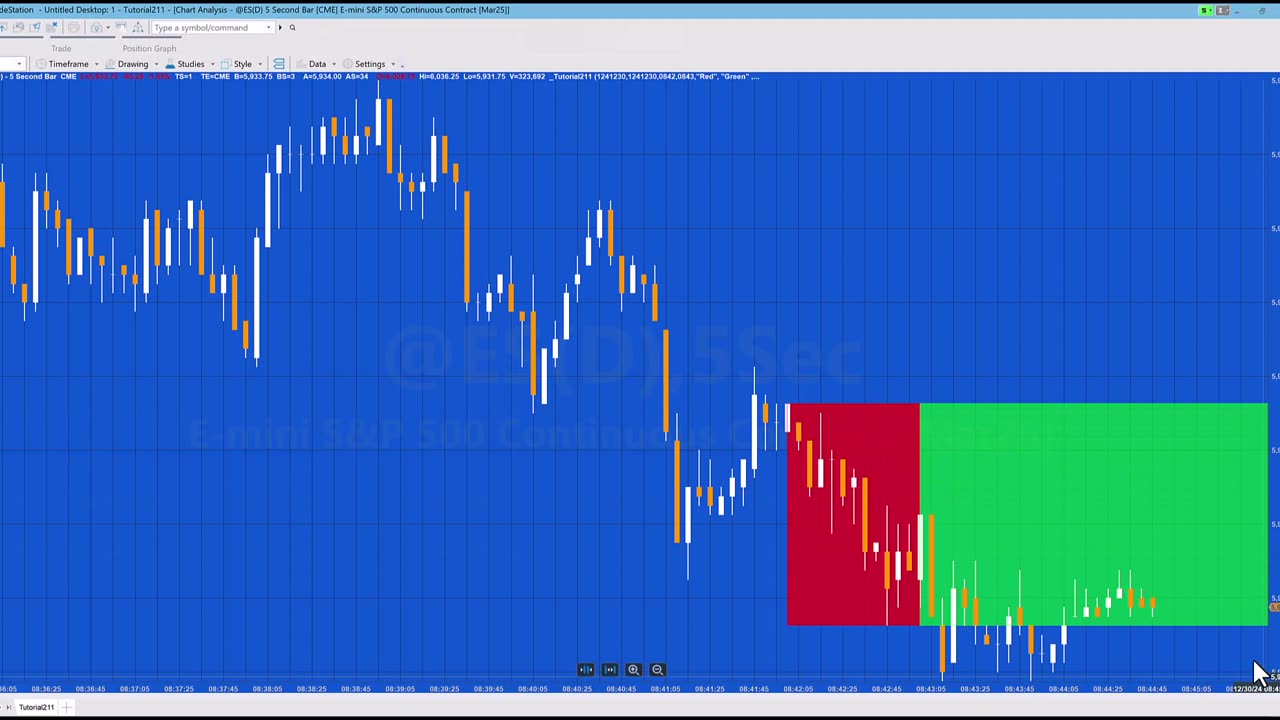
Tutorial 211 explains how to draw a rectangle on a chart between two times with the highs and lows set to be the highest high and the lowest low during the period between the two times. A second rectangle is drawn continuing the first rectangle to the end of the chart. The rectangles are drawn using a method.
The tutorial also shows how to convert dates and time to DateTime format and how to created DateTime points.
The tutorial program is able to draw rectangles for historical times that have already passed as well as future bars.
Loading comments...
-
 9:52
9:52
MattMorseTV
13 hours ago $12.91 earnedTrump just GAVE the ORDER.
14.3K49 -
 LIVE
LIVE
PudgeTV
24 minutes ago🟣 Arc Raiders - Gaming on Rumble | Monday Madness
31 watching -
 LIVE
LIVE
Max
7 hours agoMax Streaming
14 watching -
 2:13:31
The Connect: With Johnny Mitchell
1 day ago $17.36 earnedIs Garth Brooks A Serial Killer? Exposing The Dark Secrets Of Country Music's Biggest Star
29.8K13 -
 LIVE
LIVE
Phyxicx
10 hours agoBack to FF8 - Let's actually play the story now! - 11/23/2025
100 watching -
 19:19
19:19
GritsGG
15 hours agoINSANE Trio Match! Most Winning Warzone Player IGLs to Victory!
9.52K1 -
 32:24
32:24
Forrest Galante
1 day agoHunting and Eating The World's WORST Fish (Everglades At Night)
128K9 -
 11:37
11:37
The Pascal Show
1 day ago $14.45 earnedTHEY WANT TO END HER?! Candace Owens Claims French President & First Lady Put A H*t Out On Her?!
49.6K51 -
 LIVE
LIVE
Lofi Girl
3 years agolofi hip hop radio 📚 - beats to relax/study to
277 watching -
 35:40
35:40
The Why Files
5 days agoPsyops: From Dead Babies to UFOs - The Same Pattern Every Time
114K107