Tutorial 211 | Create a rectangle between 2 times and the highest/lowest price between those times
10 months ago
2
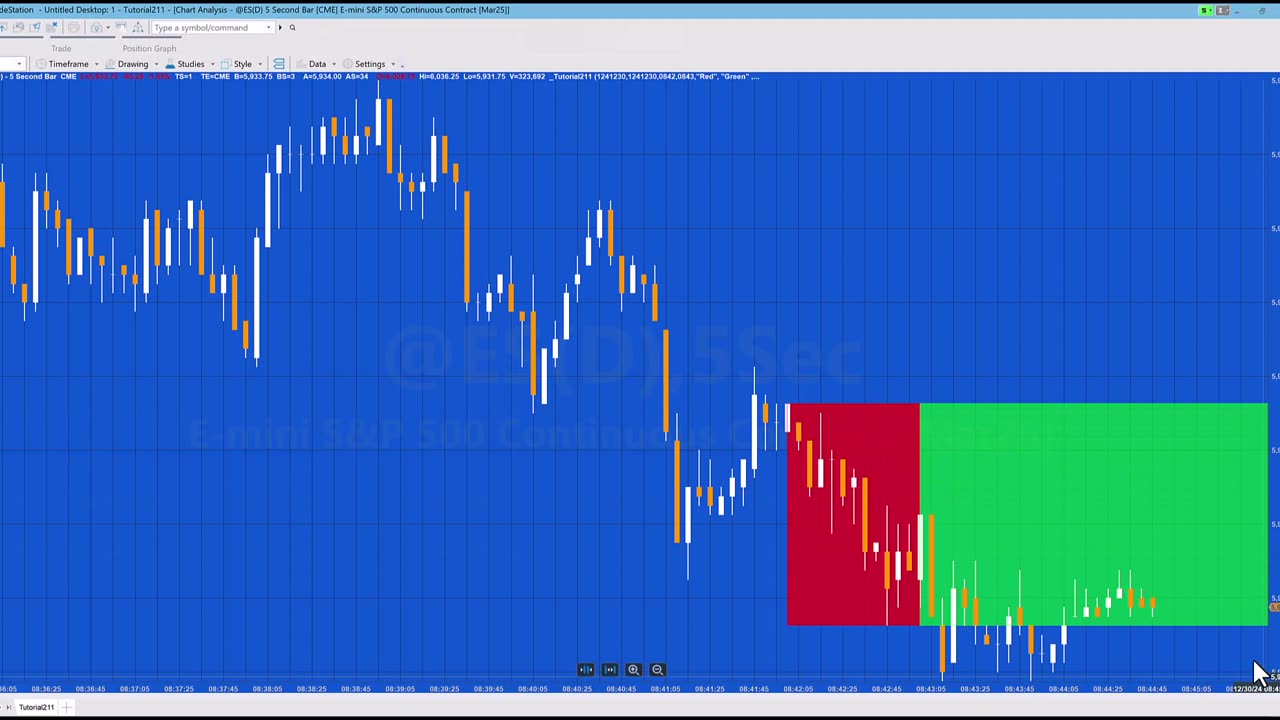
Tutorial 211 explains how to draw a rectangle on a chart between two times with the highs and lows set to be the highest high and the lowest low during the period between the two times. A second rectangle is drawn continuing the first rectangle to the end of the chart. The rectangles are drawn using a method.
The tutorial also shows how to convert dates and time to DateTime format and how to created DateTime points.
The tutorial program is able to draw rectangles for historical times that have already passed as well as future bars.
Loading comments...
-
 LIVE
LIVE
Mally_Mouse
21 hours ago🎮 Let's Play!!: Stardew Valley pt. 33
199 watching -
 LIVE
LIVE
VapinGamers
13 minutes agoForlight 84/Fortnite: Rum Bot Testing - Gaming, Coding and Other Things - !rumbot !music
10 watching -
 33:09
33:09
Exploring With Nug
2 hours agoThey Weren’t Ready for Nightfall on Blood Mountain… So I Helped Them Down
4.46K -
 LIVE
LIVE
OhHiMark1776
2 hours ago🟢 11-21-25 ||||| Two Morrows make a Day-to-Day? ||||| Livestream (2025)
19 watching -
 LIVE
LIVE
GrimmHollywood
9 hours ago🔴LIVE • GRIMM HOLLYWOOD x SILVER FOX • GOLDEN YEARS • FINAL DAY • FLARE RACE • ARC RAIDERS •
39 watching -
 1:11:24
The Daily Signal
3 hours ago🚨BREAKING: Democrat Steals $5 Million from FEMA, Trump-Mamdani Meeting Gets Bizarre
3.7K -
 1:02:11
BonginoReport
5 hours agoJ.D. Vance Threatens to Kill JD Vance?! - Nightly Scroll w/ Hayley Caronia (Ep.183)
90.9K29 -
 3:09:50
Nerdrotic
15 hours ago $9.49 earnedWarner Bros Fire Sale! | Last Ronin CANNED | WICKED For Good REVIEW - Friday Night Tights 381
36.9K9 -
 LIVE
LIVE
Akademiks
2 hours agoMeg Thee Stallion Back LYING again? Offset vs Finesse2x. 6ix9ine house robbed.. HERES WHO DID IT
874 watching -
 LIVE
LIVE
SpartakusLIVE
2 hours agoFriday Night HYPE w/ YOUR King of Content
134 watching