Project Title: Interactive Data Dashboard and Custom Analytics with Pandas and Plotly | #003
Project Description: This project involves creating an interactive data analysis and visualization dashboard powered by Pandas and Plotly Dash. The dashboard provides dynamic insights, advanced filtering options, and real-time custom analytics based on user input. It includes:
1. Interactive filtering based on multiple criteria like departments, salaries, and performance scores.
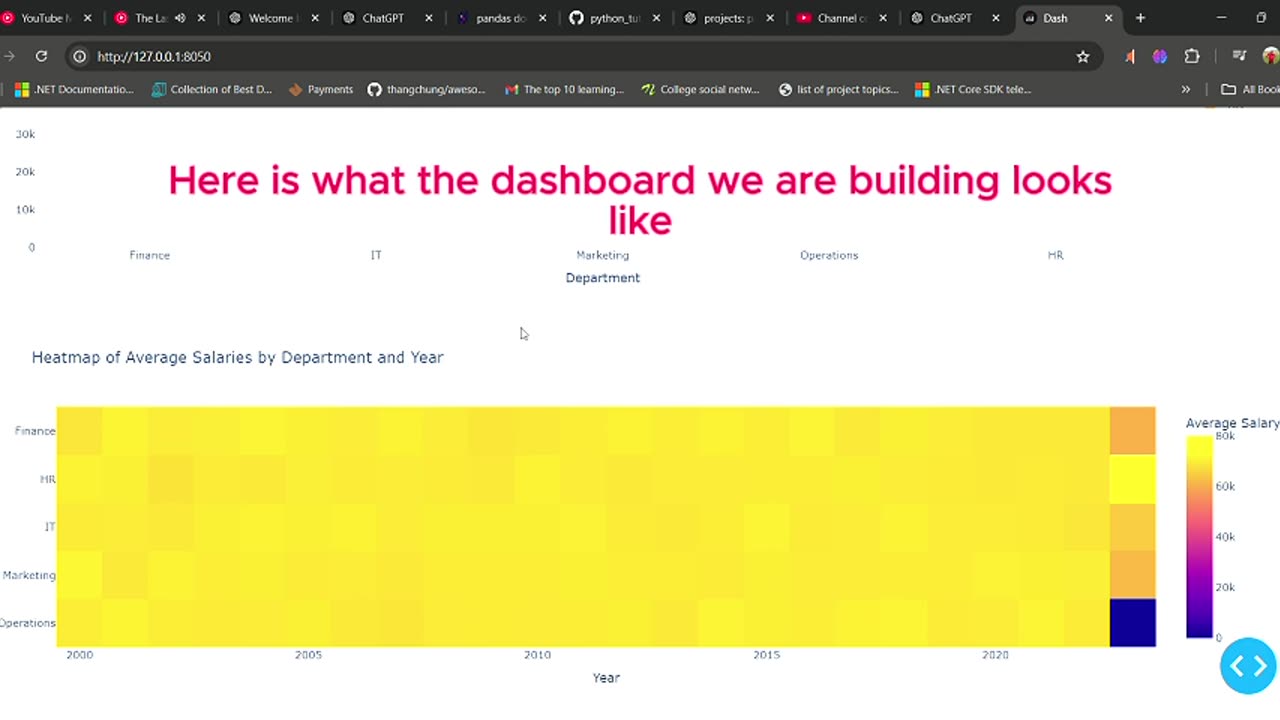
2. Advanced grouping and aggregation with interactive visualizations (heatmaps, bar charts, time-series plots).
3. Dynamic KPI generation (Key Performance Indicators) tailored to the filtered data.
4. Use of advanced pandas functions for efficient querying, grouping, and pivoting.
5. Integration of Plotly Dash for real-time interaction. This project will help users gain deeper insights into their data and build interactive dashboards for business intelligence and analytics.
-
 7:54:17
Putther
13 hours ago $21.07 earned🔴LAZY SUNDAY STREAM!! (GTA + MORE)
73K12 -
 10:38
10:38
Colion Noir
7 hours agoHe Installed a Forced Reset Trigger at a Gun Range… and Got Arrested | What You Need to Know
57.2K22 -
 1:29:26
HELMETFIRE
7 hours ago🟢GAMING WITH FIRE EP13🟢
29.5K4 -
 50:40
50:40
Sarah Westall
9 hours agoAI, Social Media & Brain Atrophy: Destroying Human Capacity to Think w/ Rob Smith
35.5K12 -
 2:32:08
THOUGHTCAST With Jeff D.
6 hours ago $16.18 earnedSunday Night FORTNITE with THOUGHTCAST Jeff D & crew.
37.8K7 -
 55:10
55:10
The Mel K Show
14 hours agoMel K & Mike L | The Tylenol Piece: It's a Marathon, Not a Sprint | 10-19-25
99.3K13 -
 3:17:37
MrMoBetta13
7 hours ago $7.14 earnedCFB26 CUT Ranked + NEW NIGHTMARE CARDS and talking college football!!
29.2K8 -
 9:20:01
Spartan
10 hours agoOMiT Spartan | God of War Ragnarok and then Halo
33.3K -
 3:19:39
FusedAegisTV
1 day agoλ Black Mesa λ (Half Life 1 Remake) █ Western Retread
23.1K2 -
 40:22
40:22
MattMorseTV
8 hours ago $28.14 earned🔴They just tried it... AGAIN.🔴
30.4K77