Premium Only Content

Project Title Advanced Data Analysis and Visualization with Pandas and Matplotlib
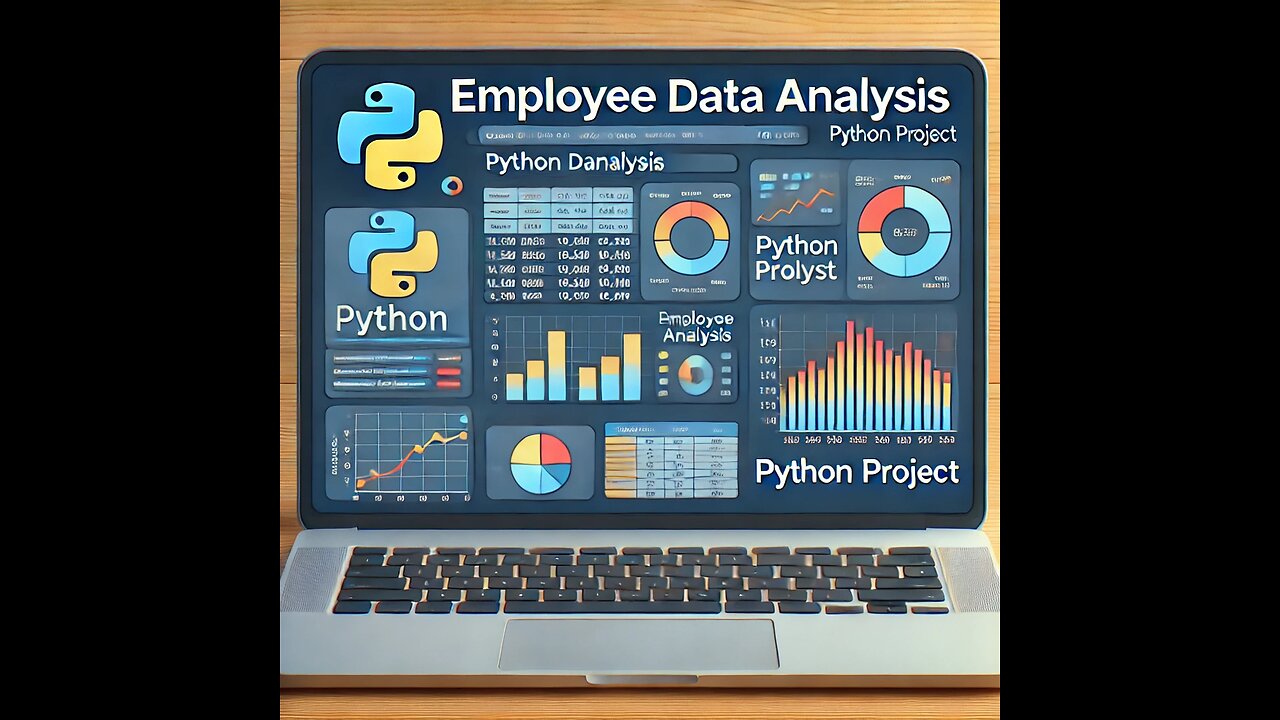
A Comprehensive Employee Data Analysis with Python: Insights & Visualizations
Description:
🚀 Unlock the Power of Employee Data with Python! In this video, we explore a comprehensive employee data analysis project using Pandas, Seaborn, and Matplotlib. You'll learn how to transform raw data into actionable insights with step-by-step explanations, visualizations, and practical examples.
🔍 What You'll Learn:
1️⃣ Department Performance Analysis: Find average performance scores across departments.
2️⃣ Salary Distribution Insights: Use pivot tables to analyze salary trends by city and department.
3️⃣ Hiring Trends: Discover time-series trends in employee hiring over the years.
4️⃣ Age & Salary Analysis: Visualize salary distribution by age group using boxplots.
5️⃣ Top Performing Cities: Identify cities with the highest average performance scores.
6️⃣ Tenure Analysis: Analyze the departments with the longest average employee tenure.
7️⃣ Correlation Study: Examine relationships between salaries and performance scores.
8️⃣ Department Visualization: Visualize department size as a percentage of total employees.
9️⃣ Hiring Trends by City: Analyze and visualize hiring trends by city over the years.
🧑💻 Tools & Libraries Used:
Python
Pandas (for data manipulation)
Seaborn & Matplotlib (for visualizations)
Excel Integration (employee_dataset.xlsx)
📊 Dataset Information:
We use an employee dataset containing essential fields such as:
Department
Performance Score
Salary
Age
Join Date
City
This dataset allows us to explore various concepts in employee analytics, such as average scores, hiring trends, salary distributions, and performance correlations.
📥 Full Project Code Including the dataset:https://oluwadamilolaadegunwa.wordpress.co...
⚡ Key Takeaways: This project is perfect for data analysts, Python enthusiasts, or anyone looking to derive insights from organizational data.
⏱️ Timestamps:
Introduction
Loading and Exploring the Dataset
Average Performance Score by Department
Salary Pivot Table: By City & Department
Hiring Trend Analysis (Time Series)
Average Salary by Age Group
Top 5 Cities for Performance Scores
Salary Distribution Visualization
Department with Longest Employee Tenure
Performance vs Salary Correlation
Department Size Visualization
Hiring Trends by City Over the Years
Conclusion
👍 If you found this video helpful, don't forget to like, comment, and subscribe for more tutorials on Python and data analysis! 🔔
🎥 Follow Along and Master Python Data Analytics Today!
#Python #DataAnalysis #EmployeeAnalytics #Pandas #Seaborn #Matplotlib #PythonProjects #DataScience #Visualization
-
 20:37
20:37
Degenerate Jay
4 hours agoThe Fantastic Four: First Steps Review - Fantastic Or Failure?
581 -
 6:43:48
JuicyJohns
6 hours ago $2.39 earned🟢#1 REBIRTH PLAYER 10.2+ KD🟢 !loadout
48.4K2 -
 1:01:52
Sean Unpaved
3 hours agoRyne Sandberg's Legacy, Madden's 99 Club, NIL's Locker Room Heat, & Wilkins' Kiss-and-Run
12.9K1 -
 6:29
6:29
Clickbait Wasteland
16 hours ago $0.15 earnedCUOMO vs ZOHRAN: Who do New Yorkers Want as the Next Mayor?
3.49K10 -
 22:10
22:10
IsaacButterfield
10 hours ago $0.45 earnedUnhinged White Woman Hates White People
8.25K21 -
 1:04:05
Timcast
3 hours agoThe TAMURA Conspiracy, Theory Says Blackstone WAS The Target Over Israel, NOT NFL
149K89 -
 2:15:27
Steven Crowder
5 hours ago🔴 NYC Shooting Exposes Massive Hypocrisy From Mamdani & the Left
339K337 -
 1:36:20
The Mel K Show
4 hours agoMORNINGS WITH MEL K - An Engaged Fed Up Citizenry is Finally Moving the Needle Towards Accountability 7-29-25
38.7K20 -
 1:17:30
Rebel News
2 hours agoByelection ballot drama, Ford flips on jobs for asylum seekers, Pipeline problems | Rebel Roundup
13.7K3 -
 59:23
59:23
The Tom Renz Show
2 hours agoThe Manhattan Shooting, Vax Accountability, & Trump's Trade Deals In Crypto World
13.9K14