Candlestick Charts_ Explained in 60 Seconds!⏱️📊
8 months ago
6
Discover why so many successful traders trust Deriv!
🔥 Open your FREE Demo Account today: https://bit.ly/3Rnmgod
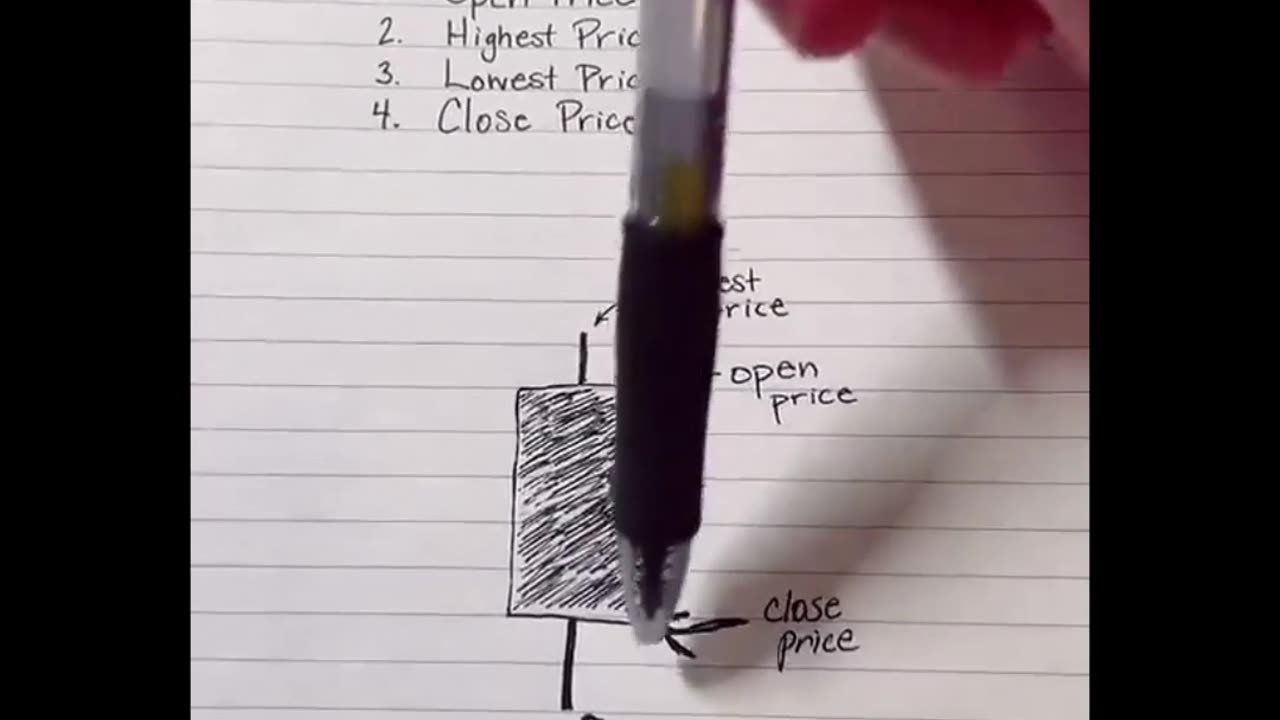
Candlestick charts show price movement over time with each 'candle' representing open, high, low, and close prices.
Bullish candle: Closes higher than it opened (green or white).
Bearish candle: Closes lower than it opened (red or black).
Wicks: Show the highest and lowest prices during that period.
Candlestick patterns like Doji, Engulfing, and Hammer can indicate potential market reversals or continuations. Master these for better entries and exits! 🚀 #CandlestickCharts #Forex #DayTrading #ChartAnalysis
Loading comments...
-
 4:09:30
StevieTLIVE
5 hours agoWarzone Wins w/ FL Mullet Man
32.1K1 -
 1:04:01
BonginoReport
8 hours agoLefties Wish Death on Trump but He’s BACK! - Nightly Scroll w/ Hayley Caronia (Ep.125)
189K83 -
 3:18:28
Tundra Tactical
5 hours ago $3.49 earnedWe Survived the Military… But Not This Basement
35K -
 20:12
20:12
Clownfish TV
13 hours agoDisney Needs MEN Back?! They ADMIT Star Wars and Marvel are DEAD!
28.3K39 -
 1:37:00
Anthony Rogers
12 hours agoEpisode 381 - Tim Kelleher
19K1 -
 1:01:42
The Nick DiPaolo Show Channel
10 hours agoTDS Hits New Level! | The Nick Di Paolo Show #1786
55K40 -
 1:02:27
Michael Franzese
8 hours agoFace to Face with a Former Chinatown Gangster Turned NYPD Detective
53.1K13 -
 1:31:25
The Confessionals
13 hours agoThe Queen of Heaven Exposed (Hathor, Lilith & Ancient Gods Return)
35K8 -
 13:09:26
LFA TV
19 hours agoLFA TV ALL DAY STREAM - TUESDAY 9/2/25
200K14 -
 3:17:57
LIVE WITH CHRIS'WORLD
10 hours agoLIVE WITH CHRIS'WORLD - IT WORKED IN D.C. & IT WILL WORK IN CHICAGO
20.6K6