Excel Charts & Graphs for Advanced Financial analysis📈
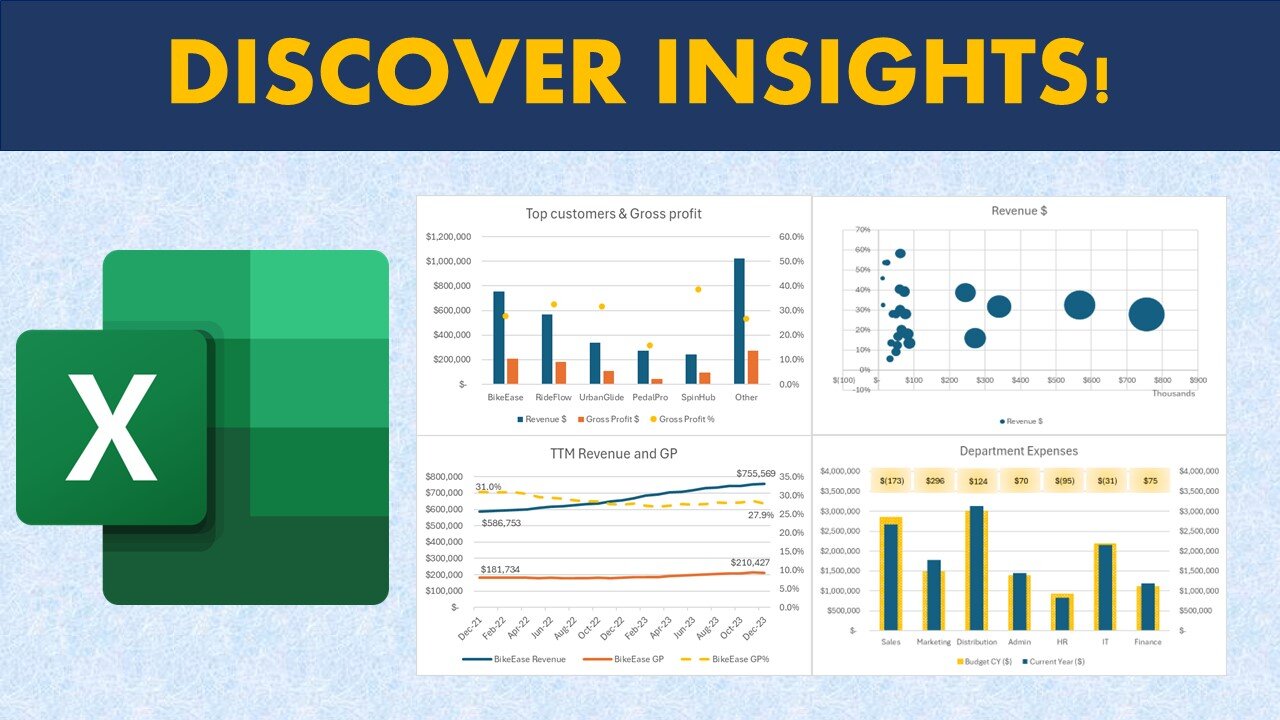
00:16 Chart visualization for Revenue and Gross profit including Profit Margin (%)
00:39 Bubble Chart for customer profitability analysis
01:01 Chart for Revenue and gross profit margin trend (Trend analysis)
01:54 Charts for Expenses vs budget analysis
02:13 Chart to highlight categories of spend vs budget
02:25 Forecast Chart
02:34 Chart for Outlier Analysis
02:54 Create Clustered column charts in Excel
04:17 Create Customer profitability Bubble charts in Excel
05:27 Create Trend Analysis (Line chart) in Excel
07:26 Budget vs Actual spend chart in Excel
09:23 Waterfall Chart for spend analysis in Excel
10:07 Create a forecast chart in Excel
11:36 Create scatter chart for sales commission analysis in Excel
📊 Unlock Financial Insights:
Discover the art of data visualization as we explore advanced techniques for financial analysis. Our step-by-step guide will empower you to go beyond traditional methods, allowing you to unlock valuable financial insights hidden within your datasets.
📈 Revenue and Gross Profit Analysis:
Learn how to conduct thorough revenue and gross profit analysis using dynamic Excel charts. Uncover trends, patterns, and key financial indicators to drive strategic decisions.
📉 Expenses vs Budget:
Navigate the complexities of budgeting and expenses with insightful graphs. We'll guide you through creating visual representations that simplify expense tracking and budget analysis.
🔄 Data Relationships and Forecasting:
Explore the world of data relationships and forecasting through Excel charts. Understand how to identify correlations, predict future trends, and make informed decisions based on your financial data.
🚀 Excel Tips & Techniques:
Whether you're a financial analyst, business professional, or Excel enthusiast, this tutorial is tailored for you. We'll showcase Excel tips and techniques that elevate your financial modeling, budgeting, and reporting skills to new heights.
💡 Tags:
Financial Analysis, Excel Charts, Data Visualization, Financial Modeling, Business Analytics, Excel Tips, Financial Insights, Data Analysis, Graphs Tutorial, Excel for Finance, Financial Reporting, Data Visualization Techniques, Financial Dashboards, Excel Graphing, Budgeting in Excel, Excel Techniques, Visual Data Analysis, Finance Tools, Excel Tutorial, Spreadsheet Analytics
-
 8:06
8:06
China Uncensored
14 hours agoThis Could Be China’s LAST CHANCE To Save Its Economy
6.4K15 -
 LIVE
LIVE
The Bubba Army
2 days agoDocumentary Premiere, A HUGE SUCCESS! - Bubba the Love Sponge® Show | 9/08/25
1,866 watching -
 32:15
32:15
DeVory Darkins
9 hours ago $5.01 earnedDemocrats PAINFULLY WRECKED by Tom Homan as paid protesters ERUPT in Chicago
6.75K34 -
 16:59
16:59
Degenerate Jay
13 hours ago $2.12 earnedIs Metal Gear Solid Delta: Snake Eater Worth Buying?
27.5K2 -
 4:26:28
Flex011
5 hours ago $0.16 earnedCronos: The New Dawn – Brutal Time-Travel Horror Survival
3.47K2 -
 33:11
33:11
The Finance Hub
17 hours ago $1.65 earnedBREAKING: JD VANCE JUST RELEASED A MASSIVE BOMBSHELL!!! OMG!!
7.97K23 -
 18:06
18:06
Professor Gerdes Explains 🇺🇦
15 hours agoAfter Major Attack, Trump Vows "Phase II" Sanctions on Russia
8.56K10 -
 5:24:59
EVASIVE_rabbi
5 hours ago✅️ 2 Dumb Navy Vets & A First Playthrough #Coop ✅️
4.28K1 -

Cook14u
10 hours agoSeahawks Let Me Down, DO NOT Talk About How I Look 🤐🙃🥴
2.76K -
 8:18
8:18
MattMorseTV
16 hours ago $9.72 earned2.2 MILLION in ONE YEAR.
69.5K146