Excel Charts & Graphs for Advanced Financial analysis📈
00:16 Chart visualization for Revenue and Gross profit including Profit Margin (%)
00:39 Bubble Chart for customer profitability analysis
01:01 Chart for Revenue and gross profit margin trend (Trend analysis)
01:54 Charts for Expenses vs budget analysis
02:13 Chart to highlight categories of spend vs budget
02:25 Forecast Chart
02:34 Chart for Outlier Analysis
02:54 Create Clustered column charts in Excel
04:17 Create Customer profitability Bubble charts in Excel
05:27 Create Trend Analysis (Line chart) in Excel
07:26 Budget vs Actual spend chart in Excel
09:23 Waterfall Chart for spend analysis in Excel
10:07 Create a forecast chart in Excel
11:36 Create scatter chart for sales commission analysis in Excel
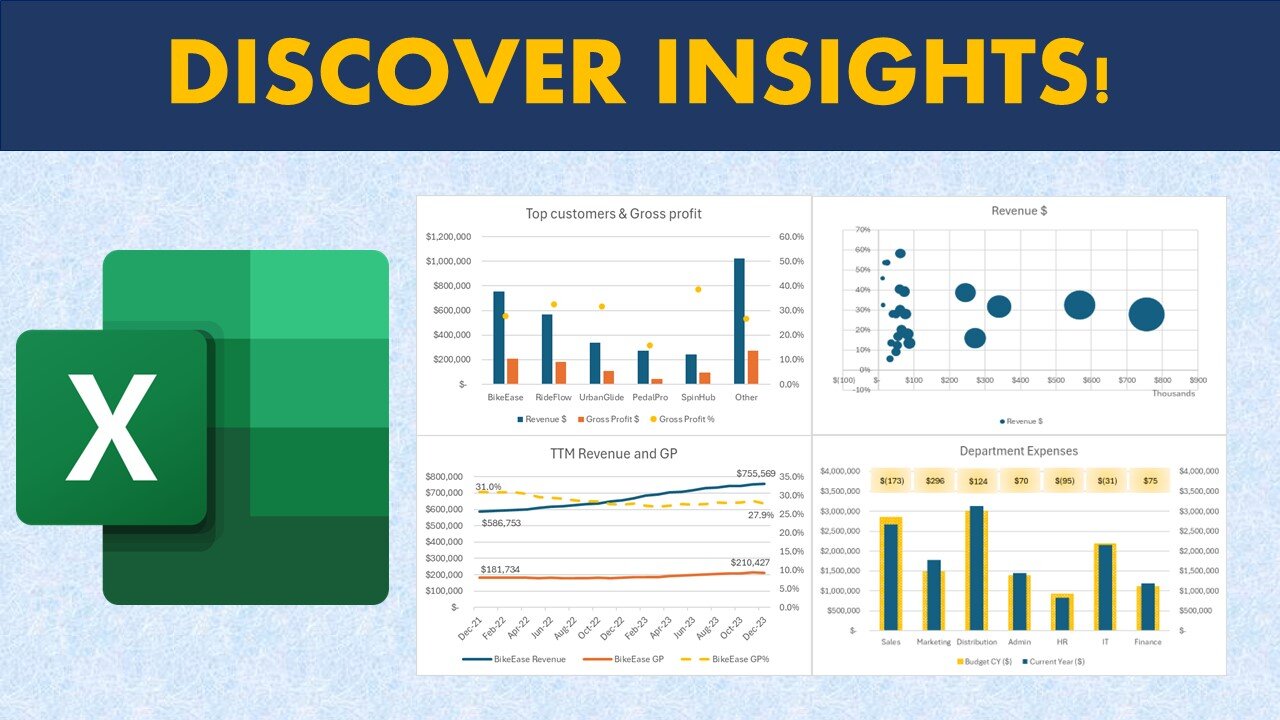
📊 Unlock Financial Insights:
Discover the art of data visualization as we explore advanced techniques for financial analysis. Our step-by-step guide will empower you to go beyond traditional methods, allowing you to unlock valuable financial insights hidden within your datasets.
📈 Revenue and Gross Profit Analysis:
Learn how to conduct thorough revenue and gross profit analysis using dynamic Excel charts. Uncover trends, patterns, and key financial indicators to drive strategic decisions.
📉 Expenses vs Budget:
Navigate the complexities of budgeting and expenses with insightful graphs. We'll guide you through creating visual representations that simplify expense tracking and budget analysis.
🔄 Data Relationships and Forecasting:
Explore the world of data relationships and forecasting through Excel charts. Understand how to identify correlations, predict future trends, and make informed decisions based on your financial data.
🚀 Excel Tips & Techniques:
Whether you're a financial analyst, business professional, or Excel enthusiast, this tutorial is tailored for you. We'll showcase Excel tips and techniques that elevate your financial modeling, budgeting, and reporting skills to new heights.
💡 Tags:
Financial Analysis, Excel Charts, Data Visualization, Financial Modeling, Business Analytics, Excel Tips, Financial Insights, Data Analysis, Graphs Tutorial, Excel for Finance, Financial Reporting, Data Visualization Techniques, Financial Dashboards, Excel Graphing, Budgeting in Excel, Excel Techniques, Visual Data Analysis, Finance Tools, Excel Tutorial, Spreadsheet Analytics
-
 LIVE
LIVE
Quite Frankly
7 hours agoAmelia Earhart, Obamacare Implodes, JFK, MUCH More | J Gulinello 10/8/25
169 watching -
 1:07:38
TheCrucible
2 hours agoThe Extravaganza! EP: 50 (10/08/25)
76.3K11 -
 1:27:22
Kim Iversen
2 hours agoThis Outsider Could Finally Take Down The Establishment | Candace Owens Was Right, Now Who Killed Charlie?
18.7K51 -
 1:30:28
Redacted News
3 hours agoIsrael's Government on the Verge of Collapse? Israeli's demand Netanyahu resign NOW | Redacted News
105K97 -
 1:09:29
vivafrei
4 hours agoRaja Jackson Charges Explained! James Comey Peads "Not Guilty"! L.A. Firest Were ARSON! & More!
108K36 -
 24:41
24:41
CharLee Simons presents DO NOT TALK
18 hours agoDINESH D'SOUZA is back on DO NOT TALK
9.98K1 -
 4:22:47
Right Side Broadcasting Network
8 hours agoLIVE REPLAY: President Trump Participates in a Roundtable on ANTIFA - 10/8/25
106K97 -
 LIVE
LIVE
Dr Disrespect
8 hours ago🔴LIVE - DR DISRESPECT - BLACK OPS 7 - BANG BANG BANG
1,237 watching -
 1:35:05
The White House
4 hours agoPresident Trump Participates in a Roundtable on ANTIFA
41.8K45 -
 LIVE
LIVE
LFA TV
19 hours agoLIVE & BREAKING NEWS! | WEDNESDAY 10/8/25
992 watching
