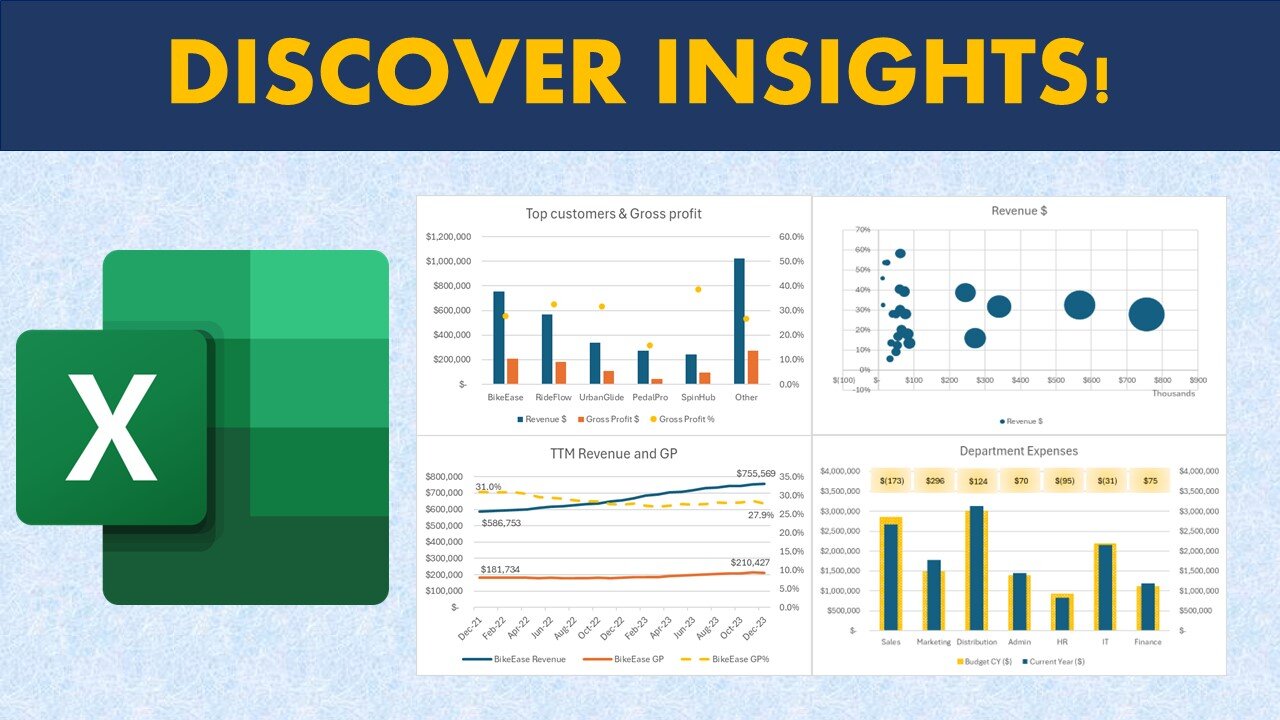
Excel Charts & Graphs for Advanced Financial analysis📈
00:16 Chart visualization for Revenue and Gross profit including Profit Margin (%)
00:39 Bubble Chart for customer profitability analysis
01:01 Chart for Revenue and gross profit margin trend (Trend analysis)
01:54 Charts for Expenses vs budget analysis
02:13 Chart to highlight categories of spend vs budget
02:25 Forecast Chart
02:34 Chart for Outlier Analysis
02:54 Create Clustered column charts in Excel
04:17 Create Customer profitability Bubble charts in Excel
05:27 Create Trend Analysis (Line chart) in Excel
07:26 Budget vs Actual spend chart in Excel
09:23 Waterfall Chart for spend analysis in Excel
10:07 Create a forecast chart in Excel
11:36 Create scatter chart for sales commission analysis in Excel
📊 Unlock Financial Insights:
Discover the art of data visualization as we explore advanced techniques for financial analysis. Our step-by-step guide will empower you to go beyond traditional methods, allowing you to unlock valuable financial insights hidden within your datasets.
📈 Revenue and Gross Profit Analysis:
Learn how to conduct thorough revenue and gross profit analysis using dynamic Excel charts. Uncover trends, patterns, and key financial indicators to drive strategic decisions.
📉 Expenses vs Budget:
Navigate the complexities of budgeting and expenses with insightful graphs. We'll guide you through creating visual representations that simplify expense tracking and budget analysis.
🔄 Data Relationships and Forecasting:
Explore the world of data relationships and forecasting through Excel charts. Understand how to identify correlations, predict future trends, and make informed decisions based on your financial data.
🚀 Excel Tips & Techniques:
Whether you're a financial analyst, business professional, or Excel enthusiast, this tutorial is tailored for you. We'll showcase Excel tips and techniques that elevate your financial modeling, budgeting, and reporting skills to new heights.
💡 Tags:
Financial Analysis, Excel Charts, Data Visualization, Financial Modeling, Business Analytics, Excel Tips, Financial Insights, Data Analysis, Graphs Tutorial, Excel for Finance, Financial Reporting, Data Visualization Techniques, Financial Dashboards, Excel Graphing, Budgeting in Excel, Excel Techniques, Visual Data Analysis, Finance Tools, Excel Tutorial, Spreadsheet Analytics
-
 12:54
12:54
MetatronGaming
3 hours agoYou Remember Super Mario WRONG and I can Prove it
1324 -
 1:02:55
Russell Brand
3 hours agoThe Epstein Files Are Coming — And The Establishment Is Terrified! - SF653
67.2K14 -
 32:47
32:47
The White House
3 hours agoPresident Trump Meets with Zohran Mamdani, Mayor-Elect, New York City
22.4K44 -
 1:07:21
The Quartering
2 hours agoPeace Between Ukraine & Russia? Kimmel Meltdown & More layoffs
15.8K10 -
 LIVE
LIVE
Barry Cunningham
3 hours agoBREAKING NEWS: PRESIDENT TRUMP MEETS WITH COMMIE MAMDANI | AND MORE NEWS!
1,443 watching -
 LIVE
LIVE
LadyDesireeMusic
1 hour agoLive Piano Music & Convo | Anti Brain Rot | Make Ladies Great Again | White Pill of the Day
105 watching -
 LIVE
LIVE
StoneMountain64
3 hours agoArc Raiders Making Money and LEVELING Up
106 watching -
 LIVE
LIVE
ReAnimateHer
5 hours agoNell’s Diner Is OPEN… For Your Final Meal
46 watching -
 14:53
14:53
Neil McCoy-Ward
10 hours ago🇦🇺 Australian Censorship Chief SUMMONED For Questioning In USA!!! 🇺🇸
6.73K9 -
![MAHA News [11.21] CDC Changes Vaccine/Autism Website & Pharma Freaks, SNAP = Corporate Welfare](https://1a-1791.com/video/fwe2/88/s8/1/-/-/O/B/--OBz.0kob-small-MAHA-News-11.21.jpg) 1:01:04
1:01:04
Badlands Media
16 hours agoMAHA News [11.21] CDC Changes Vaccine/Autism Website & Pharma Freaks, SNAP = Corporate Welfare
10.6K6