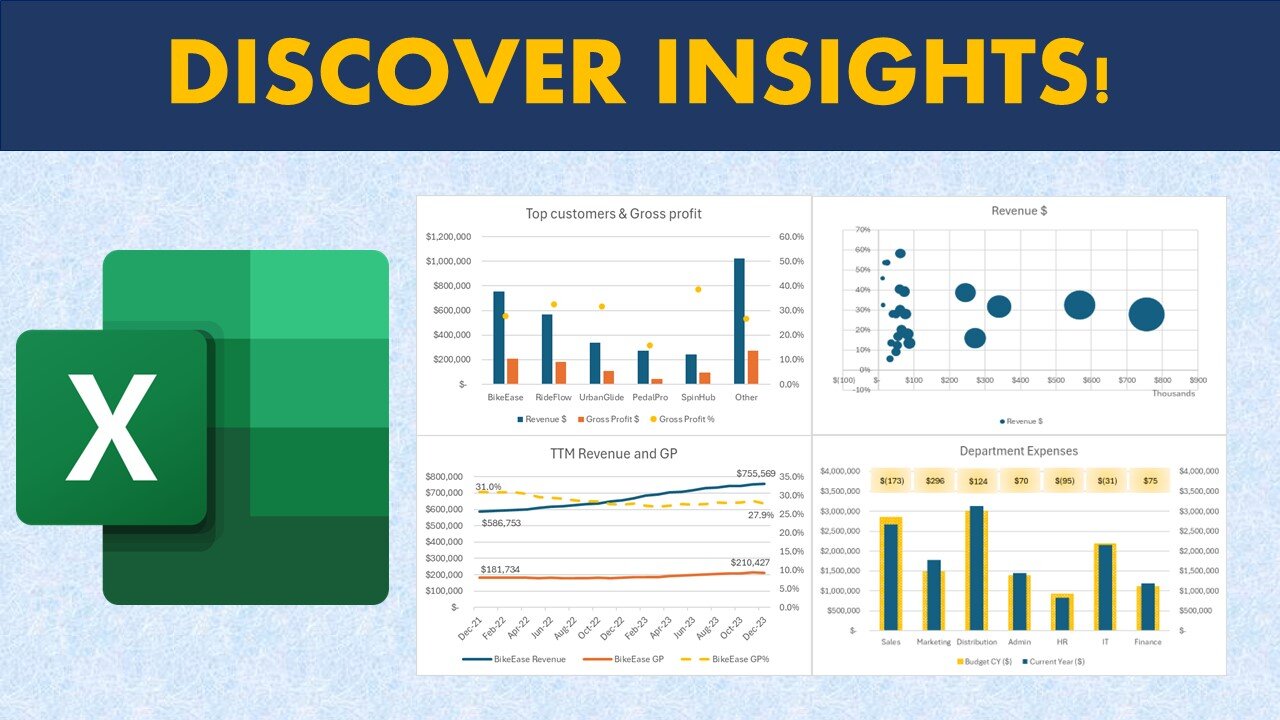
Excel Charts & Graphs for Advanced Financial analysis📈
00:16 Chart visualization for Revenue and Gross profit including Profit Margin (%)
00:39 Bubble Chart for customer profitability analysis
01:01 Chart for Revenue and gross profit margin trend (Trend analysis)
01:54 Charts for Expenses vs budget analysis
02:13 Chart to highlight categories of spend vs budget
02:25 Forecast Chart
02:34 Chart for Outlier Analysis
02:54 Create Clustered column charts in Excel
04:17 Create Customer profitability Bubble charts in Excel
05:27 Create Trend Analysis (Line chart) in Excel
07:26 Budget vs Actual spend chart in Excel
09:23 Waterfall Chart for spend analysis in Excel
10:07 Create a forecast chart in Excel
11:36 Create scatter chart for sales commission analysis in Excel
📊 Unlock Financial Insights:
Discover the art of data visualization as we explore advanced techniques for financial analysis. Our step-by-step guide will empower you to go beyond traditional methods, allowing you to unlock valuable financial insights hidden within your datasets.
📈 Revenue and Gross Profit Analysis:
Learn how to conduct thorough revenue and gross profit analysis using dynamic Excel charts. Uncover trends, patterns, and key financial indicators to drive strategic decisions.
📉 Expenses vs Budget:
Navigate the complexities of budgeting and expenses with insightful graphs. We'll guide you through creating visual representations that simplify expense tracking and budget analysis.
🔄 Data Relationships and Forecasting:
Explore the world of data relationships and forecasting through Excel charts. Understand how to identify correlations, predict future trends, and make informed decisions based on your financial data.
🚀 Excel Tips & Techniques:
Whether you're a financial analyst, business professional, or Excel enthusiast, this tutorial is tailored for you. We'll showcase Excel tips and techniques that elevate your financial modeling, budgeting, and reporting skills to new heights.
💡 Tags:
Financial Analysis, Excel Charts, Data Visualization, Financial Modeling, Business Analytics, Excel Tips, Financial Insights, Data Analysis, Graphs Tutorial, Excel for Finance, Financial Reporting, Data Visualization Techniques, Financial Dashboards, Excel Graphing, Budgeting in Excel, Excel Techniques, Visual Data Analysis, Finance Tools, Excel Tutorial, Spreadsheet Analytics
-
 UPCOMING
Flyover Conservatives
20 hours agoSHOCKING DATA REVEALS: Young Voters Are Done With the Old GOP - Mark Mitchell, Rasmussen Reports | FOC Show
4.81K2 -
 LIVE
LIVE
Sarah Westall
3 hours agoGrooming is Protected and Encouraged by the System – Michelle Peterson and Mike Adamovich
134 watching -
 LIVE
LIVE
Akademiks
57 minutes agoKendrick tries to Flip the Bots on DRAKE? WHo Beats Jay z in a verzuz. Blueface finally free!
961 watching -
 LIVE
LIVE
Professor Nez
6 hours ago🚨ELECTION NIGHT 2025 LIVE! Massive Upsets Brewing in New York, New Jersey & Virginia!
164 watching -
 LIVE
LIVE
Due Dissidence
9 hours agoLIVE: ELECTION RESULTS From NYC, NJ, and VA - Trump Approval CRATERS, Kash's Private Jet CRASH OUT
1,282 watching -
 12:50
12:50
Demons Row
2 hours ago $0.46 earnedBikers of New Jersey 💀🏍️ Pagans, Thunder Guards, and Thug Riders
3.88K3 -
 42:31
42:31
Stephen Gardner
5 hours ago🔥Old Obama Video RESURFACES - His Own Words CONDEMNED Him! Trump Gains MASSIVE Momentum!!
11.3K17 -
 13:09:35
LFA TV
1 day agoLIVE & BREAKING NEWS! | TUESDAY 11/4/25
159K34 -
 1:03:37
BonginoReport
4 hours agoElection Night Showdown Spotlight - Nightly Scroll w/ Hayley Caronia (Ep.170)
99.6K29 -
 1:11:17
Edge of Wonder
4 hours agoSupernatural Forces & Giants Built Great Pyramid of Egypt
12.1K