Premium Only Content

Watching the Sun: 45 years of satellite data
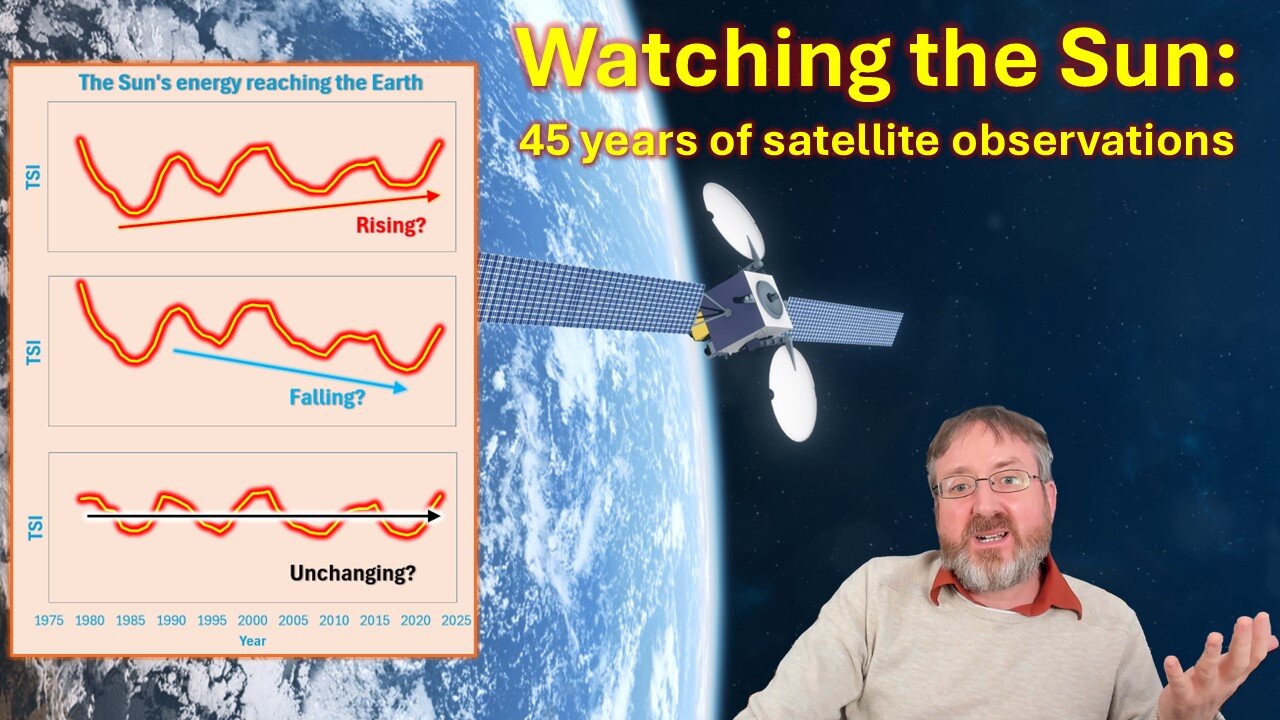
In this video, Dr. Ronan Connolly (Center for Environmental Research and Earth Sciences, www.ceres-science.com) describes his latest paper on the Total Solar Irradiance (TSI) measurements in the satellite era, 1978-present. TSI represents the amount of energy reaching the Earth from the Sun.
Scientists have been debating what trends, if any, there have been in TSI since the first TSI satellites were launched in 1978. Some scientists have claimed that there has been almost no long-term changes other than an 11-year up-and-down cycle tracking the sunspot cycles. Others have suggested that there have been additional multi-decade-long TSI trends between each cycle.
Here, Ronan digs into these debates and presents the new results that will change our understanding of this ongoing scientific mystery.
🔹 🔹 🔹 🔹
Link to the study:
🔹 R. Connolly, W. Soon, M. Connolly, R.G. Cionco, A.G. Elias, G.W. Henry, N. Scafetta, and V.M. Velasco Herrera (2024). Multiple new or updated satellite Total Solar Irradiance (TSI) composites (1978-2023). The Astrophysical Journal, Volume 925, Issue 1, 102. https://doi.org/10.3847/1538-4357/ad7794
Other relevant links:
🔹 🔹 🔹 🔹
⭐ If you want to support the work of CERES, please visit us at https://www.ceres-science.com/support-us
Follow Dr. Ronan Connolly at the following:
🔹Home page: https://ronanconnollyscience.com/
🔹Twitter/X: https://x.com/1RonanConnolly
🔹Substack: https://substack.com/@ronanconnolly
-
 LIVE
LIVE
The Mel K Show
1 hour agoLive Q&A with Mel K 8-27-25
488 watching -
 LIVE
LIVE
Quite Frankly
6 hours ago"Planet Chaos, Life on Mars, Open Lines" ft. Oppenheimer Ranch Project 8/27/25
617 watching -
 LIVE
LIVE
The Mike Schwartz Show
7 hours agoTHE MIKE SCHWARTZ SHOW Evening Edition 08-27-2025
3,889 watching -
 1:34:24
Redacted News
4 hours agoLIVE: Minnesota School Shooter’s Shocking Motive Revealed – Plus Trump Targets Soros w AG Ken Paxton
140K145 -
 4:55:15
StoneMountain64
7 hours agoHUNTING FOR THE FIRST WIN BACK ON WARZONE
70.2K2 -
 1:09:06
The Officer Tatum
4 hours agoBREAKING: Shooter IDENTIFIED TR*NS , Cracker Barrel CAVES To Pressure + MORE | EP 162
49.1K83 -
 53:47
53:47
Matt Kohrs
5 hours agoLIVE! Nvidia Earnings Call || NVDA Stock Reaction
39K1 -
 32:25
32:25
Tudor Dixon
3 hours agoKarol Markowicz on Freedom, Immigration, and Saving the American Dream | The Tudor Dixon Podcast
14.8K -
 2:03:25
The Quartering
7 hours agoFlag Burning, Free Speech, Church Attack & More With Andrew Wilson
212K325 -
 3:02:42
The Robert Scott Bell Show
21 hours agoDr. Peter McCullough, Vaccines: Mythology, Ideology, and Reality, Dr. Dan Sullivan, Chiropractic - The RSB Show 8-27-25
32.8K1