Premium Only Content

Mastering Stock Trading: My Top 3 Indicators for Success
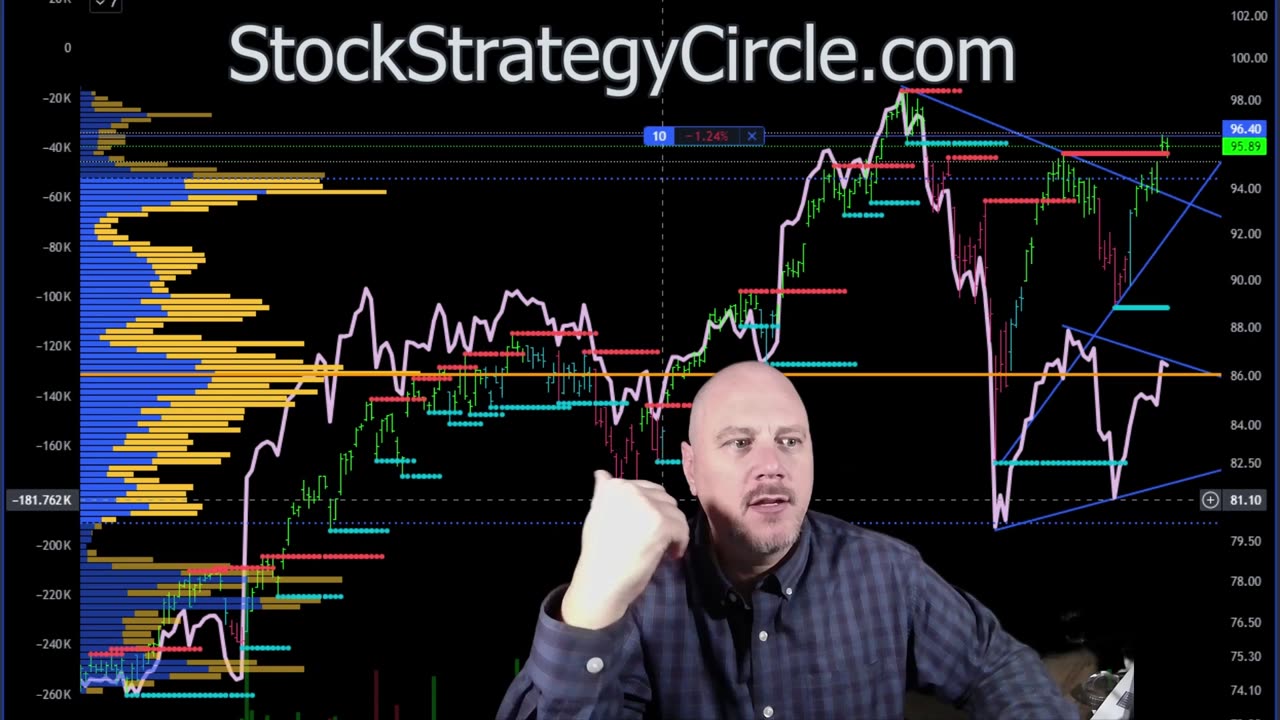
In this episode of Stock Strategy Circle, I, John, delve into the three top indicators that I rely on for trading stocks. I begin by emphasizing the limited scope of indicators available for measuring price activity, which primarily includes actual price activity, volume, the relationship between price and volume, and trend analysis. I caution listeners against cluttering their charts with redundant indicators, advocating instead for a streamlined approach that focuses on a few key tools.
The first indicator I discuss is volume, which I display in two ways: standard volume bars and a market profile style indicator. I explain the significance of unusual volume activity, noting that it often precedes substantial price movements, whether bullish or bearish. Understanding the context of volume spikes is crucial, as they can indicate either accumulation or distribution phases in a stock's trading cycle.
Next, I introduce the volatility stop, also known as a V-stop or volatility stop-loss. This indicator helps traders gauge the volatility of a security over a specified period, allowing for effective stop-loss placement and position sizing. I share my personal strategy of using a volatility stop to determine how many shares to buy based on my risk profile, emphasizing the importance of not risking more than 1-3% of one's account on any single position.
The third indicator I cover is the price volume trend (PVT), which tracks the cumulative volume in relation to price changes. I explain how PVT can confirm price movements, highlighting the importance of looking for divergences between price and volume trends. This analysis can provide insights into market conditions, such as potential distribution phases.
Throughout the episode, I also touch on the significance of time frames in trading decisions, illustrating how different chart periods can alter the interpretation of volatility and price activity. I conclude by summarizing my top indicators: volume (including volume profile), volatility stop, and price volume trend, while also introducing a bonus indicator—swings—to help identify buy and sell points.
Listeners are encouraged to join Stock Strategy Circle for trade alerts and insights into stock movements, as I actively trade and share my experiences in real-time. This episode aims to equip traders with the knowledge to make informed decisions and enhance their trading strategies.
00:00:00 - Introduction to Trading Indicators
00:01:24 - The Importance of Volume in Trading
00:02:17 - Understanding Volume Profile
00:04:04 - Using Volatility Stop-Loss
00:05:51 - Determining Trade Size with Volatility
00:08:50 - Adjusting Time Horizons for Trading
00:10:45 - Analyzing Price Activity Over Time
00:11:58 - Price Volume Trend Explained
00:13:42 - Current Market Analysis
00:15:28 - Using Price Volume Trend for Stock Selection
00:17:14 - Bonus Indicator: Swing Analysis
00:18:39 - Conclusion and Key Takeaways
00:00:32 - "There is no holy grail with the exception of the three that I'm going to show you."
00:01:45 - "Unusual volume activity almost always precedes large movements in price."
00:02:39 - "What you're going to be concerned about mostly here is where the spikes and gaps are."
00:04:15 - "A volatility stop-loss accounts for how volatile a particular security is over a set period of time."
00:05:51 - "I recommend that for most of you, you don't risk more than one to two, maybe three percent of your account size in any one position."
00:09:00 - "Your time horizon for the trade is going to change in between the time period on the chart."
00:10:45 - "This stock may be about to go through a change of phase, but we're probably going to know on Monday."
00:12:08 - "Price volume trend takes a running total of the amount of volume moving in and out of a stock based on the price activity."
00:14:03 - "If the price of the stock makes a new low, price volume trend really should make a new low as well."
00:18:39 - "You have to learn how to read volume and the volume profile so you can truly understand what's going on inside the price activity."
-
 1:05:24
BonginoReport
2 hours agoTrump Protects Old Glory in New EO! - Nightly Scroll w/ Hayley Caronia (Ep.119) - 08/25/2025
31.4K10 -
 LIVE
LIVE
The Jimmy Dore Show
1 hour agoSnoop Dogg Is DONE w/ LBGTQ+ Propaganda In Kids Movies! Trump Outlaws Burning the U.S. Flag!
5,391 watching -
 LIVE
LIVE
Quite Frankly
4 hours ago"Weekend News, All-Time Physical Feats, Mixed Reels" 8/25/25
270 watching -
 LIVE
LIVE
The Mike Schwartz Show
2 hours agoTHE MIKE SCHWARTZ SHOW Evening Edition 08-25-2025
4,113 watching -
 1:43:44
MTNTOUGH Podcast w/ Dustin Diefenderfer
16 hours agoEddie Penney: DEVGRU to Single Dad of 3 Overnight | MTNPOD #130
222 -
 1:28:57
Kim Iversen
2 hours agoSomeone Stole Kim's Identity — And Bought a Car! | Dr Drew Pinsky On Sex, Drugs & Censorship
23.4K17 -
 1:07:00
TheCrucible
2 hours agoThe Extravaganza! Ep. 26 (with special guest host Rob Noerr) 8/25/25
54.9K5 -
 7:35
7:35
Tundra Tactical
1 hour agoI Can’t Believe I’m Saying This… 2011’s Are Actually COOL Now?! 🤯
3.1K1 -
 LIVE
LIVE
Wayne Allyn Root | WAR Zone
4 hours agoWAR Zone LIVE | 25 AUGUST 2025
104 watching -
 LIVE
LIVE
Outspoken with Dr. Naomi Wolf
3 hours ago"CPA/Whistleblower Sam Antar Identifies Millions in Fraud Behind Mamdani Campaign"
124 watching