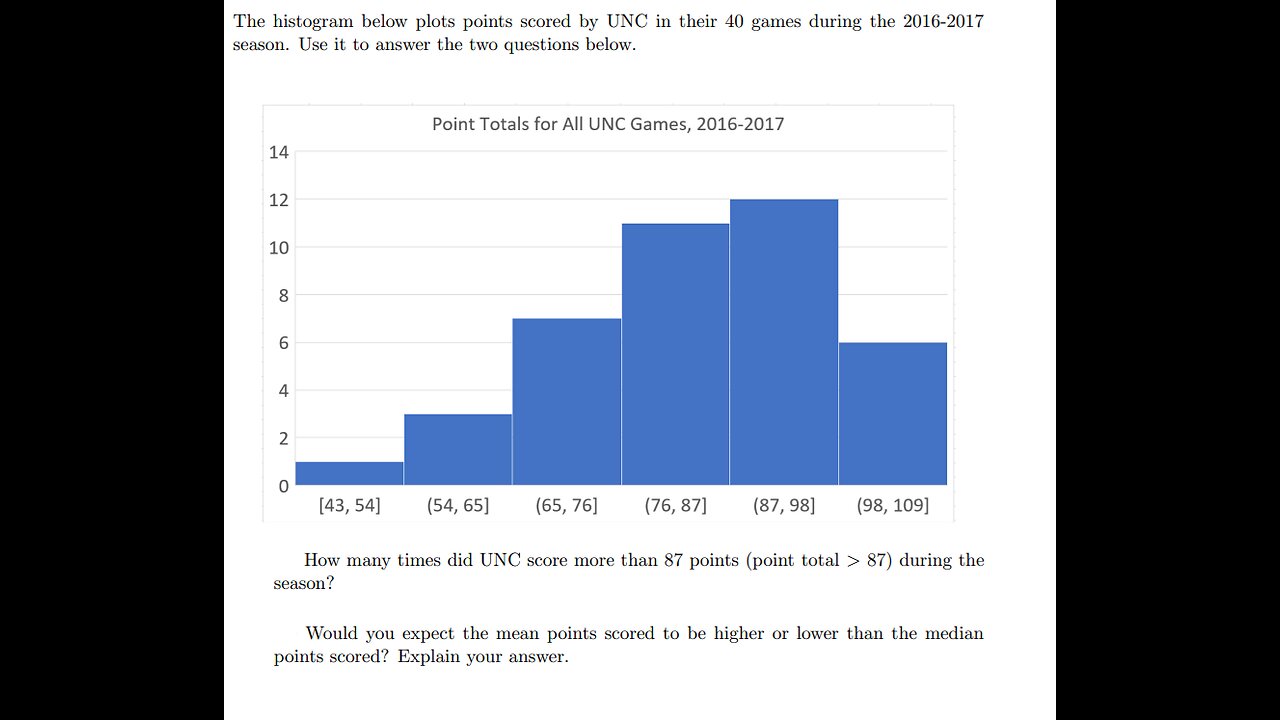
Statistics Help: The Histogram below plots points scored by UNC in their 40 games during 2016-2017
Loading comments...
-
 1:09:57
Brandon Gentile
1 day ago10,000 Hour BITCOIN Expert Reveals Why $13.5M Is Just The Start
20.5K2 -
 2:03:55
Badlands Media
7 hours agoDevolution Power Hour Ep. 382: DOJ Coverups, Clapper’s Team Sport & Trump’s Countermoves
133K22 -
 2:06:30
Inverted World Live
10 hours agoDon't Approach the Zombie Rabbits | Ep. 95
53.9K24 -
 3:26:45
Drew Hernandez
6 hours agoISRAEL PLANNING POSSIBLE DRAFT IN USA & TRUMP'S VIEW ON ETERNAL LIFE ANALYZED PT 2
41.6K47 -
 3:08:07
TimcastIRL
9 hours agoTexas Republicans Win, House Passes Redistricting Map, GOP Looks To Gain 5 Seats | Timcast IRL
192K79 -
 1:30:34
FreshandFit
9 hours agoHow To Stay Focused While Pursuing Women...The Good, The Bad, And The Ugly
65.2K39 -
 1:47:05
Drew Hernandez
14 hours agoISRAEL PLANNING POSSIBLE DRAFT IN USA & TRUMP'S VIEW ON ETERNAL LIFE ANALYZED PT 1
46.6K62 -
 29:55
29:55
Afshin Rattansi's Going Underground
3 days agoProf. Omer Bartov: The REAL REASON the US, UK, and EU Have Not Recognised Israel’s Genocide in Gaza
42.4K29 -
 6:28:34
SpartakusLIVE
11 hours agoWednesday WZ with the Challenge MASTER || Duos w/ GloryJean
56.2K1 -
 2:36:12
Barry Cunningham
11 hours agoREACTING TO STEPHEN MILLER | KASH PATEL | TULSI GABBARD INTERVIEWS AND MORE NEWS!
87.9K79