Infographic Design!
Let's dive deeper into Infographic Design!
What is Infographic Design?
Infographic design is the art of visually representing information or data in a simple and engaging way. It's about taking complex concepts and breaking them down into easy-to-understand graphics. Think of it as storytelling through visuals.
Why Use Infographics?
Clarity and Conciseness: Infographics present information in a way that is easy to grasp, even for complex topics.
Engagement: Visuals are more engaging than plain text, capturing attention and making information more memorable.
Shareability: Infographics are highly shareable on social media, increasing their reach and impact.
SEO: Search engines love visual content, and infographics can help improve a website's search ranking.
Key Elements of a Great Infographic
Clear and Concise Title: The title should clearly state the main idea.
Engaging Visuals: Use a combination of icons, images, and charts to make the infographic visually appealing.
Limited Text: Keep the text concise and easy to read.
Consistent Design: Maintain a consistent color palette, typography, and layout throughout the infographic.
Call to Action: Encourage viewers to take a specific action, such as visiting a website or sharing the infographic.
Types of Infographics
Statistical: Present data using charts, graphs, and numbers.
Process: Illustrate a sequence of steps or a workflow.
Hierarchical: Organize information in a hierarchical structure.
Geographic: Visualize data related to a specific location.
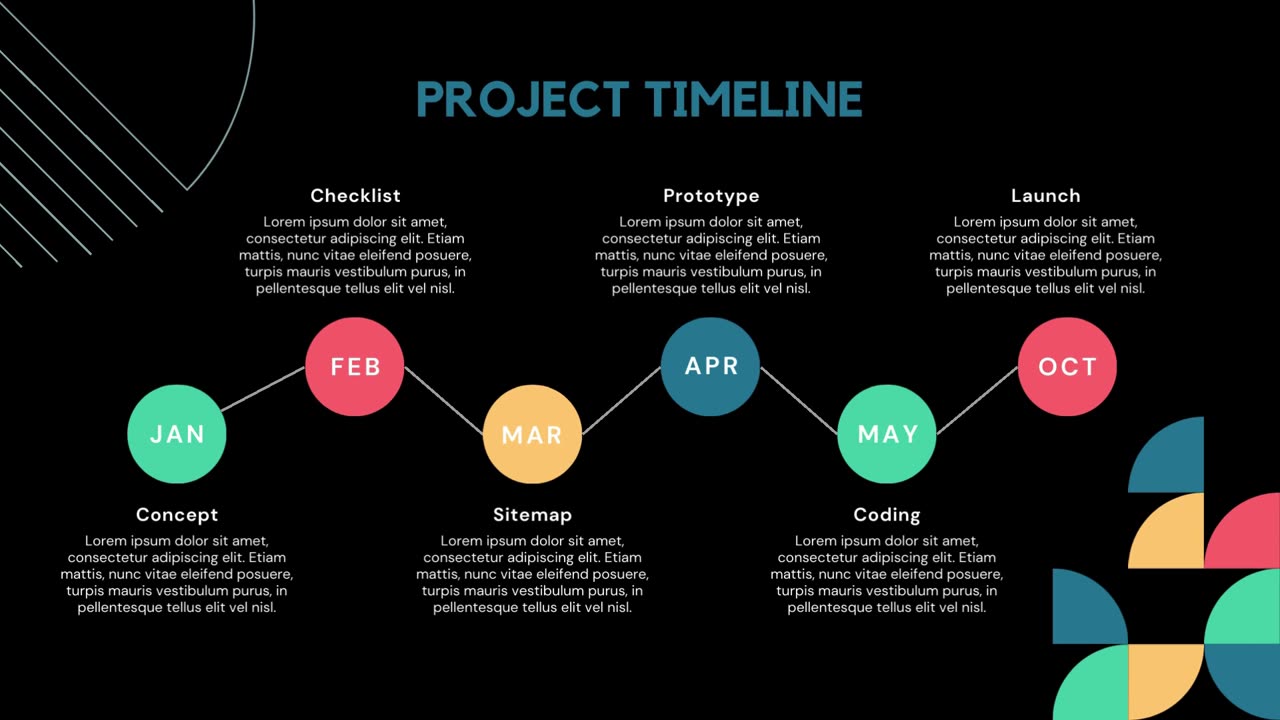
Timeline: Present information chronologically.
Tools for Creating Infographics
Canva: A user-friendly platform with a vast library of templates and elements.
Piktochart: Offers a variety of customizable templates and data visualization tools.
Venngage: Provides a wide range of infographic types and customization options.
Adobe Illustrator: A professional-grade vector graphics editor for creating highly customized infographics.
Tips for Effective Infographic Design
Know your audience: Tailor the infographic to the specific interests and knowledge level of your target audience.
Choose the right format: Select the format that best suits your data and message.
Prioritize clarity: Avoid clutter and focus on the most important information.
Tell a story: Create a narrative that guides the viewer through the infographic.
Test and iterate: Get feedback from others and make adjustments as needed.
Would you like me to help you create an infographic? I can assist you with:
Brainstorming ideas
Choosing the right tools
Designing your infographic
Providing feedback on your design
-
 LIVE
LIVE
Spartan
3 hours agoPro Halo Player | Ranked + SWTOR
172 watching -
 1:34:00
Nick Freitas
6 hours agoCan Elon Musk’s America Party Actually Win?
31.6K16 -
 2:37:04
megimu32
4 hours agoOTS: The Matrix Was About WHAT?! Trans Allegory, Cancel Culture & Comedic Chaos
11.2K7 -
 LIVE
LIVE
VapinGamers
3 hours ago $0.01 earnedDestiny 2 - Just Cause and Goodies, Let's Talk New Stuff - !rumbot !music
322 watching -
![Batman Arkham Knight [6K Reshade Mods] Hardest Difficulty ⋆ Western Retread](https://1a-1791.com/video/fww1/4a/s8/1/M/p/x/0/Mpx0y.0kob.1-small-Batman-Arkham-Knight-6K-Res.jpg) LIVE
LIVE
FusedAegisTV
9 hours agoBatman Arkham Knight [6K Reshade Mods] Hardest Difficulty ⋆ Western Retread
61 watching -
 31:35
31:35
Solar Groove Muzic
1 day ago $0.01 earnedDeep House Mix 2025 | Deep House, Vocal House, Nu Disco, Chillout
8.99K2 -
 1:21:31
Glenn Greenwald
6 hours agoTrump Mocks Concerns About Epstein; Trump Continues Biden's Policy of Arming Ukraine; Trump and Lula Exchange Barbs Over Brazil | SYSTEM UPDATE #483
117K123 -
 54:26
54:26
Edge of Wonder
9 hours agoTexas Floods: Boots on the Ground with Shawn Livingston
26.1K8 -
 1:38:45
LIVE WITH CHRIS'WORLD
4 hours agoLIVE WITH CHRIS'WORLD - DO YOU FEEL LIED TO?
27.3K6 -
 1:06:31
BonginoReport
7 hours agoIs Trump Trying To Sweep Epstein Under The Rug? - Nightly Scroll w/ Hayley Caronia (Ep.85)
164K224