TRADING Pattern 3 - LEARN and EARN #trading #stockmarket #finance #trending #trendingshorts
A price pattern that denotes a temporary interruption of an existing trend is a continuation pattern. A continuation pattern can be considered a pause during a prevailing trend. This is when the bulls catch their breath during an uptrend or when the bears relax for a moment during a downtrend.
2
While a price pattern is forming, there is no way to tell if the trend will continue or reverse. As such, careful attention must be placed on the trendlines used to draw the price pattern and whether the price breaks above or below the continuation zone. Technical analysts typically recommend assuming a trend will continue until it is confirmed that it has reversed.
In general, the longer the price pattern takes to develop, and the larger the price movement within the pattern, the more significant the move once the price breaks above or below the area of continuation.
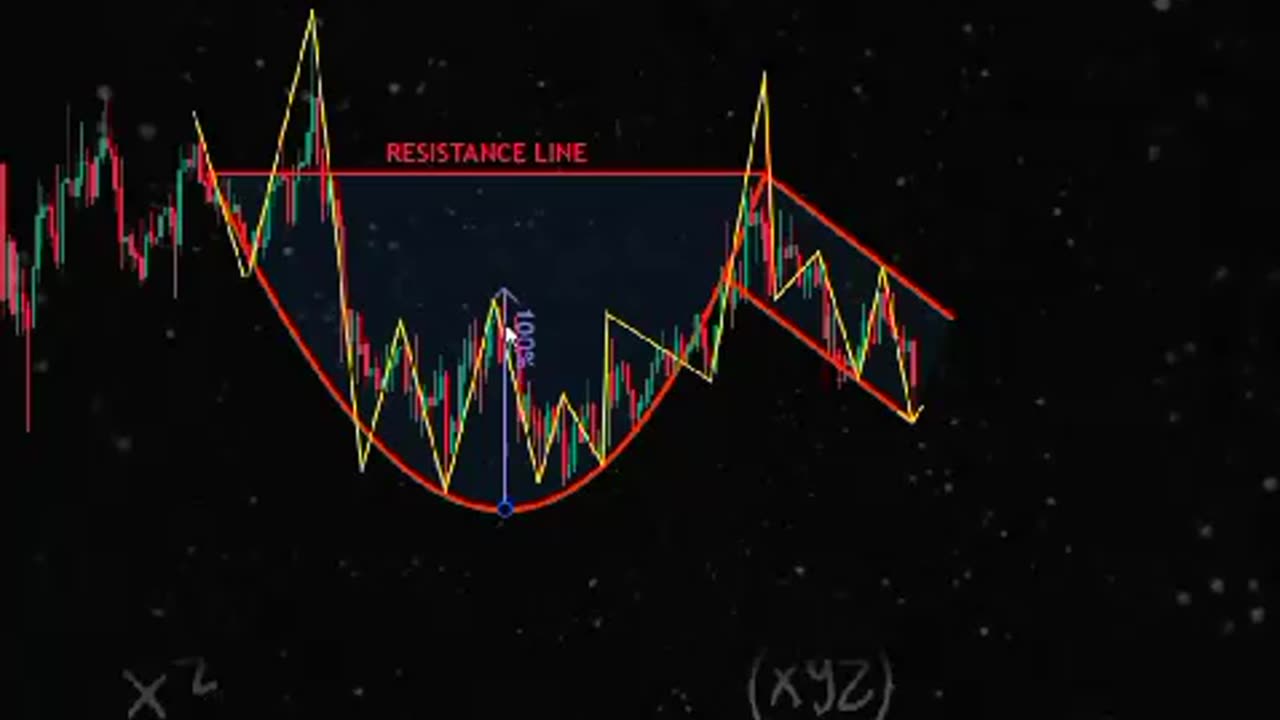
If the price continues on its trend, the price pattern is known as a continuation pattern. Common continuation patterns include:
Pennants, constructed using two converging trendlines
Flags, drawn with two parallel trendlines
Wedges, constructed with two trendlines that would converge if they were long enough, where both are angled either up or down
Triangles are among the most popular chart patterns used in technical analysis since they occur frequently compared to other patterns. The three most common types of triangles are symmetrical triangles, ascending triangles, and descending triangles. These chart patterns can last anywhere from a couple of weeks to several months.
Reversal Patterns
A price pattern that signals a change in the prevailing trend is known as a reversal pattern. These patterns signify periods where the bulls or the bears have run out of steam. The established trend will pause, then head in a new direction as new energy emerges from the other side (bull or bear).
3
For example, an uptrend supported by enthusiasm from the bulls can pause, signifying even pressure from both the bulls and bears, then eventually give way to the bears. This results in a change in trend to the downside.
Reversals that occur at market tops are known as distribution patterns, where the trading instrument becomes more enthusiastically sold than bought. Conversely, reversals that occur at market bottoms are known as accumulation patterns, where the trading instrument becomes more actively bought than sold.
-
 LIVE
LIVE
FreshandFit
4 hours agoAfter Hours w/ Girls
24,360 watching -
 2:33:36
Badlands Media
5 hours agoOnlyLands Ep. 21
37.5K4 -
 1:07:26
Inverted World Live
8 hours agoThe War Against Robots w/ Joe Allen
62.7K2 -
 6:08:31
SpartakusLIVE
8 hours agoWARZONE NUKE IS BACK?! || Solo Challenge CHAMPION to start, duos w/ the Dawg later
70.5K -
 1:00:18
Man in America
9 hours agoBig Pharma’s Empire of Lies Is COLLAPSING as People Turn to Natural Medicine
32.3K9 -
 LIVE
LIVE
Drew Hernandez
11 hours agoGHISLAINE MAXWELL SAYS CLAIMS EPSTEIN WAS INTELLIGENCE ASSET ARE BULLSH*T?!
652 watching -
 29:54
29:54
Afshin Rattansi's Going Underground
19 hours agoUkraine: Prof. Anatol Lieven SLAMS Europe’s ‘BLOODY STUPIDITY’ as Trump Negotiates with Putin
12.4K5 -
 15:27
15:27
robbijan
1 day ago $2.35 earnedThe Emperor’s New Labubu & The Spiritual War Behind Everything
37.3K41 -
 LIVE
LIVE
GritsGG
17 hours ago36 Hour Stream! Most Wins 3420+ 🧠
512 watching -
 2:05:47
TimcastIRL
5 hours agoTrump FBI Raids John Bolton Amid Classified Docs Investigation | Timcast IRL
164K63