Premium Only Content

TRADING Pattern 2 - LEARN and EARN
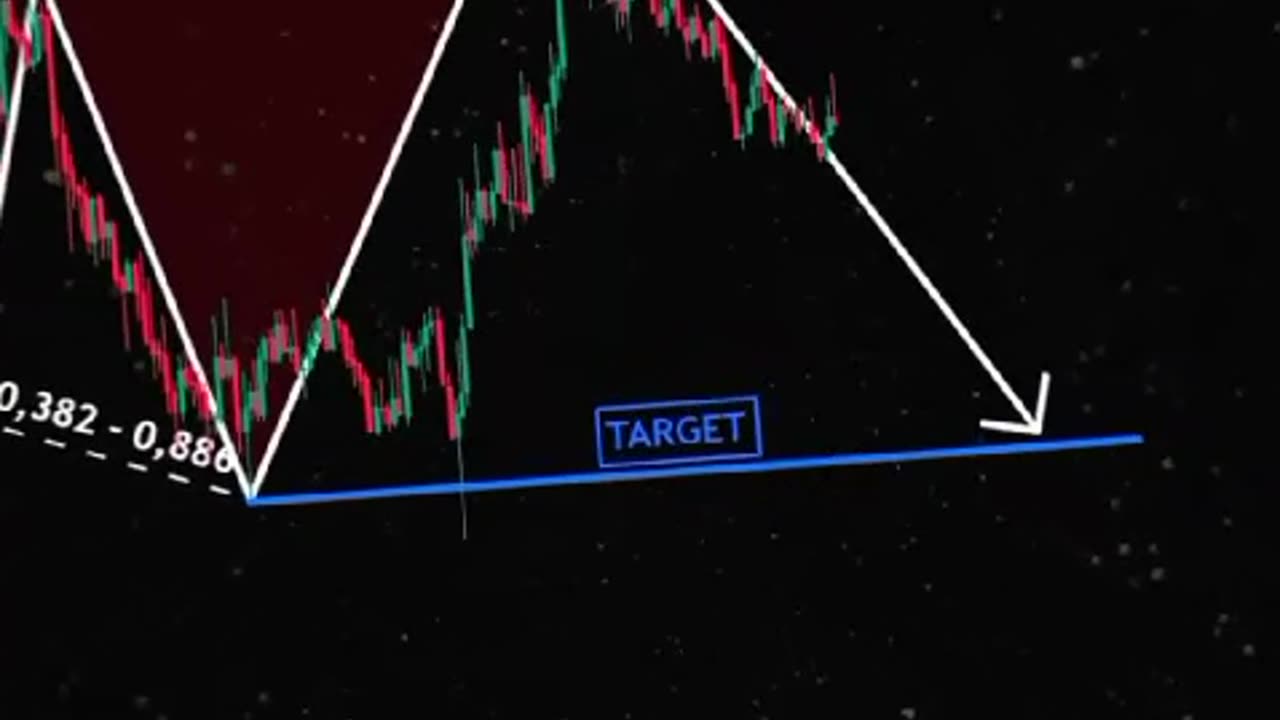
Stock chart patterns often signal transitions between rising and falling trends. A price pattern is a recognizable configuration of price movement identified using a series of trendlines and/or curves.
When a price pattern signals a change in trend direction, it is known as a reversal pattern; a continuation pattern forecasts that the trend will continue in its existing direction, possibly following a brief pause. There are many patterns used by traders—here is how patterns are made and some of the most popular ones.
Key Takeaways
Patterns are the distinctive formations created by the movements of security prices on a chart and are the foundation of technical analysis.
A pattern is identified by a line connecting common price points, such as closing prices or highs or lows, during a specific period.
Technical analysts and chartists seek to identify patterns to anticipate the future direction of a security’s price.
These patterns can be as simple as trendlines and as complex as double head-and-shoulders formations.
Trendlines in Technical Analysis
Since price patterns are identified using a series of lines or curves, it is helpful to understand trendlines and know how to draw them. Trendlines help technical analysts spot support and resistance areas on a price chart. Trendlines are straight lines drawn on a chart by connecting a series of descending peaks (highs) or ascending troughs (lows).
A trendline that angles up, or an up trendline, occurs where prices are experiencing higher highs and higher lows. The up trendline is drawn by connecting the ascending lows. Conversely, a trendline that is angled down, called a down trendline, occurs where prices are experiencing lower highs and lower lows.
1
-
 7:23
7:23
Danny Rayes
4 days ago $0.01 earnedAI Is Getting Out of Control...
25 -
 13:39
13:39
Fit'n Fire
13 hours ago $0.06 earnedKel-Tec RDB Got Even Better?
611 -
 9:02
9:02
Advanced Level Diagnostics
6 days ago2007 Toyota Camry - I Wish They Were All This Simple!
511 -
 4:22
4:22
NAG Daily
12 hours agoRUMBLE RUNDOWN – THE RUMBLE COLLAB SHOW EP.1 W/GreenMan Reports
765 -
 1:46:35
Badlands Media
1 day agoDevolution Power Hour Ep. 401: Trump’s Third Term, AI Judges & the New Revolution
415K73 -
 4:44:53
MattMorseTV
10 hours ago $219.38 earned🔴Antifa action INBOUND.🔴
204K121 -
 2:11:24
Tundra Tactical
13 hours ago $63.56 earnedTundra Nation Live - Tundra's Guns?? We Finally See What Tundra Shoots
48.2K4 -
 2:44:07
BlackDiamondGunsandGear
13 hours agoAFTER HOURS ARMORY / Whiskey & Windage
26.1K2 -
 23:56
23:56
marcushouse
22 hours ago $24.98 earnedStarship Began the Demolition!? 🔥
45.7K6 -
 17:59
17:59
JohnXSantos
1 day ago $7.33 earnedI Gave AI 14 Days to Build NEW $5K/MONTH Clothing Brand
29.4K4