QuickTip 95 | Drawing a rectangle between two times and prices
1 year ago
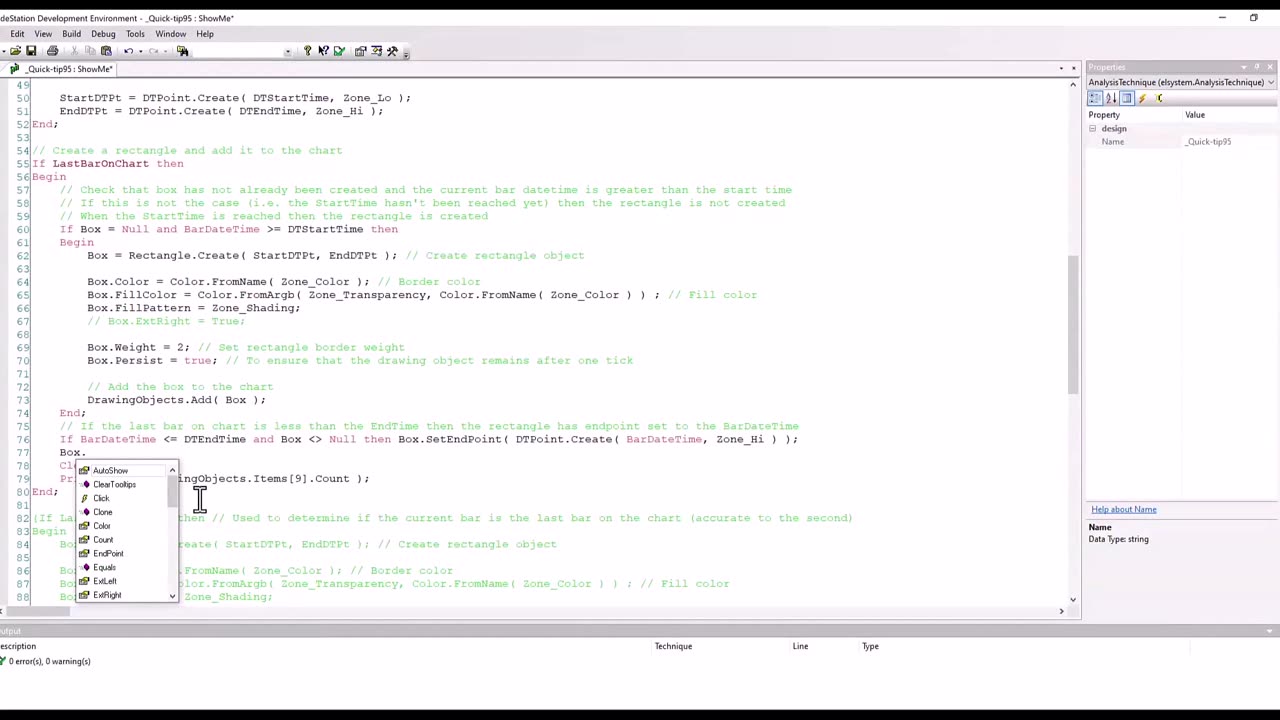
Quick-tip 95 explains how to draw a rectangle on a chart between two times. In the first part of the tutorial I demonstrate simple syntax to draw a rectangle. I also explain a couple of potential problems. In the second part of the tutorial I explain how these problems may be resolved.
The quick-tip also explains how to convert dates and time to DateTime format and how to created DateTime points.
Loading comments...
-
 21:54
21:54
The Pascal Show
8 hours ago $0.05 earned$1.5 MILLION HIT?! Candace Owens Drops More Shocking Info On Her France Hit Plot THIS IS INSANE!
1.56K2 -
 LIVE
LIVE
Lofi Girl
3 years agolofi hip hop radio 📚 - beats to relax/study to
182 watching -
 1:29:13
ThisIsDeLaCruz
8 hours agoRunning Sound for 1.6 MILLION PEOPLE!!! Madonna In Rio
9.12K2 -
 2:18:52
FreshandFit
12 hours agoBlack Girl Gets Triggered After We Said THIS....
195K43 -
 1:46:40
Badlands Media
13 hours agoBaseless Conspiracies Ep. 160: The Kosovo Organ Harvesting Cover-Up
72.1K17 -
 2:04:16
Inverted World Live
9 hours agoTwo Texas Men Plotted to Invade Haiti | Ep. 146
68.9K8 -
 2:54:20
TimcastIRL
7 hours agoClinton Judge JUST DISMISSED James, Comey Indictment, Trump DOJ APPEALS | Timcast IRL
230K133 -
 3:01:32
SpartakusLIVE
5 hours agoCreator House LIVE STREAM || ASSUAGING the RAGE of viewers by streaming DEEP into the Night
33.7K1 -
 17:37
17:37
MetatronHistory
1 day agoThe REAL Origins of the GREEKS
30.3K12 -
 1:19:32
The Daily Signal
10 hours ago $11.79 earned🚨BREAKING: James Comey & Letitia James NOT "Off the Hook" on Indictments, Sen. Kelly Court Martial?
36.9K5