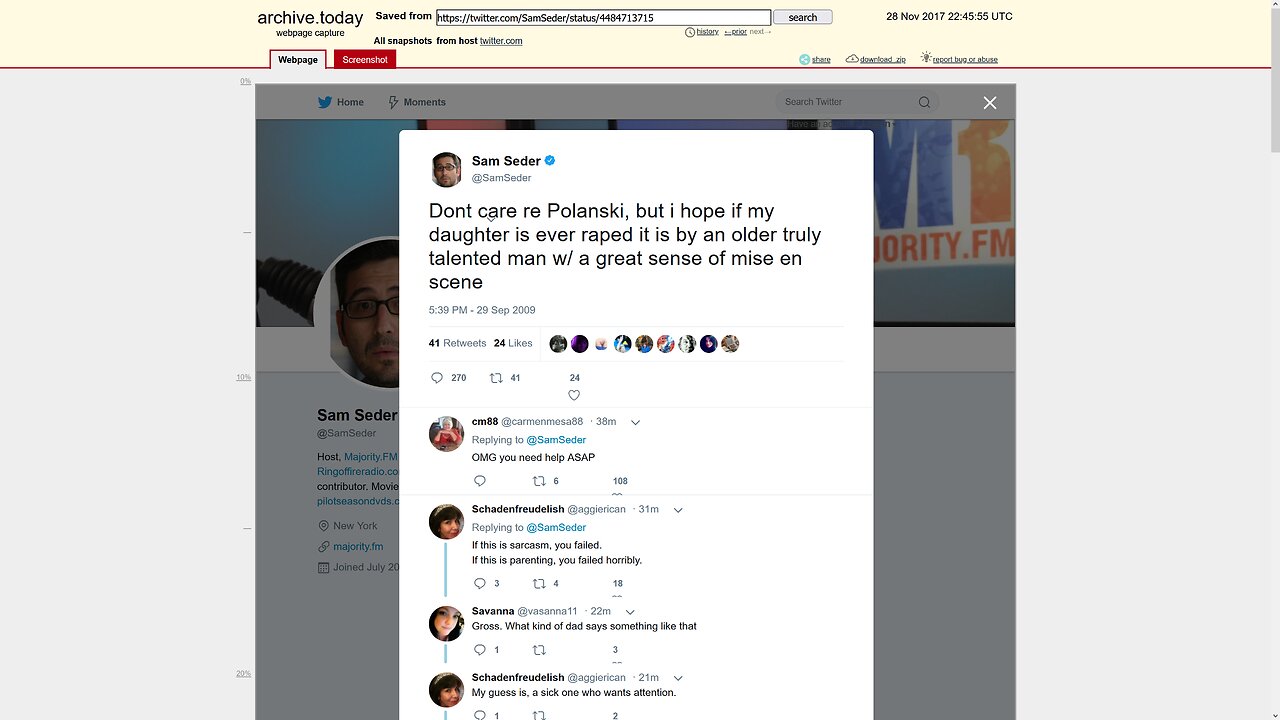
Creepy old man Sam Seder hates charter schools Part III
Blacks are >80% of all long-term suspensions in Portsmouth. Portsmouth City is 5% Hispanic & 51.4% Black, the Student Body is 51.8% Black & 5% Hispanic.
https://nces.ed.gov/ccd/districtsearch/district_detail.asp?Search=2&ID2=5102670 https://nces.ed.gov/Programs/Edge/ACSDashboard/5102670 https://schoolquality.virginia.gov/divisions/norfolk-city-public-schools#desktopTabs-2 https://schoolquality.virginia.gov/divisions/norfolk-city-public-schools#desktopTabs-6 Norfolk, VA: Families with Food Stamp/SNAP benefits (31.6%), Parents (of children in Government school) not in the labor force (17.5%), Children in Government School living w/ a married couple (44.5%) & Children in Government School living in a single parent household (49.2%)
English Reading Performance for all pupils in Norfolk (school years ending 2021-2023), 58.66% of all students were proficient or better, 49.33% of Blacks, Hispanic = 56%, Asian = 83%, Whites = 78.66% & ELLs = 23.33%.
English Writing Performance (school years ending 2022 & 2023), 48.5% of all Norfolk students “passed” (proficient or better), 38.5% of Blacks, Hispanic = 49.5%, Asian = 81%, White = 69% & ELLs = 13%.
School years ending 2021-23, 20.36% of Norfolk’s Student Body (20.2% in 2023) was “chronically absent.” In school year ending 2023, 23.2% of Blacks were chronically absent, Hispanic = 20.6%, Whites = 13.7%, Asians = 5.7% & ELLs = 22.3%.
https://schoolquality.virginia.gov/divisions/norfolk-city-public-schools#desktopTabs-4 School years ending 2021-23, 84.13% of Norfolk students graduated on time. For the same time frame, 82% of Blacks graduated on time, Hispanic = 76.33%, Asian = 98.66%, White = 90.9% & ELLs = 74%.
Look at the percentages of ELLs & Blacks that are not passing English Writing Performance & Reading Performance & tell me how their on-time Graduation Rates are as high as they are (this goes for a lot of Districts).
In short, I call B.S. on the rising graduation rates over the past few decades, I think a lot of Government Schools are creating brain dead SJWs (on purpose) & then just passing them through, they don’t care.
The kiddie groomer Democrat might say, “Uh derp, they still be readin’ good enuff to graduate.” If they’re not “passing” reading or writing, why are they getting a diploma, unless “failing” is actually “passing.”
Timmy can’t read a newspaper or understand it, but he knows his pronouns & he learned about oral sex when he was eight. He also learned that he might be a little girl. How are they supposed to get a job that requires brain power?
As Larry Elder would say, “School choice is the answer.” Democrats, creepy old men like Sam Seder or creepy overweight women like Latifah Faisal (Story County, Iowa Supervisor) don’t want school choice because then they don’t get to talk to your kids about preteen cousins having oral sex w/ each other. https://rumble.com/v4kjlg9-latifah-faisal-story-county-iowa-board-of-supervisors-likes-herself-some-co.html
Norfolk City is 8.7% Hispanic & 40.7% Black, the Student Body is 40.1% Black & 9% Hispanic.
https://nces.ed.gov/Programs/Edge/ACSDashboard/2102990 https://nces.ed.gov/ccd/districtsearch/district_detail.asp?Search=2&ID2=2102990 https://www.kyschoolreportcard.com https://www.kyschoolreportcard.com/organization/5590?year=2023 Louisville, Kentucky: Families with Food Stamp/SNAP benefits (23%), Parents (of children in Government school) not in the labor force (14.7%), Children in Government School living w/ a married couple (52.3%) & Children in Government School living in a single parent household (40.1%)
https://www.kyschoolreportcard.com/organization/5590/school_accountability/proficiency/reading?year=2023 For school years ending 2022 & 2023, (Elementary School) 62.5% of all students were NOT proficient in Reading. For school years ending 2022 & 2023 (High School), 63% of all Jefferson County students are NOT proficient (or better) in Reading.
School years 2022 & 2023 (High School), 78.5% of Black pupils in Jefferson County were NOT proficient in Reading, Hispanic = 67.5%, Asian = 36% & White = 50%.
School years ending 2018 & 2019 (Jefferson Co.), 61.95% of all HS Students were NOT proficient in Reading, 79.95% of Black HS students were NOT proficient, Hispanic = 72.55%, Asian = 47.25% & White = 47.35%.
https://www.kyschoolreportcard.com/organization/20/school_accountability/proficiency/reading?year=2023 Statewide (school years 2022 & 2023), 54% of Elementary pupils were NOT proficient in Reading & 56% of High School pupils were NOT proficient in Reading.
Statewide, (school years 2022 & 2023, High School) 77% of Blacks were NOT proficient in Reading, Hispanic = 67%, Asian = 35% & White = 52%.
https://www.kyschoolreportcard.com/organization/5590/academic_performance/assessment_performance/national_assessment_of_educational_progress?year=2023 NAEP Grade 4 Reading, 38% of all students are “below basic,” 58% of Blacks, 30% of Asians, 49% of Hispanics, 34% of Whites & 70% of ELLs in Kentucky.
https://www.kyschoolreportcard.com/organization/5590/school_safety/safety/safe_schools_data?year=2023 https://www.kyschoolreportcard.com/organization/5590/school_safety/safety/safe_schools_data?year=2022 https://www.kyschoolreportcard.com/organization/5590/school_safety/safety/safe_schools_data?year=2021 Black students (males particularly) tend to get out of school suspensions far more often than other groups, it’s either systemic racism or a discipline problem, likely arising from a home life that is dysfunctional. There were very few suspensions meted out in 2021, the schools closed because… plandemic.
Many of these kids that drop out and/or get suspended often likely end up part of Louisville’s massive murder problem. Change my mind!
https://brightbytes-public.s3-us-west-2.amazonaws.com/kde/2023/chronic_absenteeism_2023.csv https://www.kyschoolreportcard.com/organization/5590/school_overview/students/attendance?year=2023 School year ending 2023, 38.27% of all students were “chronically absent” (Jefferson County). Blacks had a rate of 43.73%, Hispanic = 42.89%, White = 33.2%, Asian = 18.42% & ELLs = 38.99%.
Statewide, Asians had a chronic absentee rate of 13.4%, Black = 34.95%, White = 29.41%, Hispanic = 30.14%, ELLs = 27.08% & all students = 29.81%. Gee, why is Jefferson County so much worse on all metrics than KY statewide? Racism is not causing about 1/3 of “students of color” to miss more than 10% of the school year.
https://www.kyschoolreportcard.com/organization/5590/transition_readiness/academic_readiness/graduates?year=2023 https://brightbytes-public.s3-us-west-2.amazonaws.com/kde/2023/student_graduates_count_2023.csv They’re not giving a Graduation Rate & I am NOT going to look at enrollment & calculate a % for multiple years. Sue me.
https://www.kyschoolreportcard.com/organization/20/school_overview/students/dropout_retention?year=2023 https://brightbytes-public.s3-us-west-2.amazonaws.com/kde/2023/retention_2023.csv https://www.kyschoolreportcard.com/organization/5590/school_overview/students/dropout_retention?year=2023 School years ending 2023 & 2022 in Jefferson Co, 2.4% of all students dropped out. Blacks = 2.6%, Asian = 0.8%, White = 2.1%, Hispanic = 3.7% & ELLs = 5.75%.
Statewide for all students (2022 & 2023) = 1.3%, Blacks = 2.3%, Hispanic = 2.4%, White = 1.1%, Asian = 0.6% & ELLs = 4.55%. Again & on all metrics, the Democrat stronghold of Jefferson County is performing poorly, relative to the state average. Lots of “students of color,” the folks Democrats pretend to care about are not able to read or write proficiently. We need a change, but Democrats will fight tooth-and-nail on this because they need to talk to your kids about homosexuality, they need to talk to them about mutilating their genitals. Reading well is not part of the program, sexual dysfunction & personal pronouns are.
Louisville City/Jefferson County, Kentucky is 6.8% Hispanic & 23.9% Black & the Student Body is 21.7% Black & 6% Hispanic.
https://nces.ed.gov/ccd/districtsearch/district_detail.asp?Search=2&ID2=3624750 https://nces.ed.gov/Programs/Edge/ACSDashboard/3624750 https://data.nysed.gov/ https://data.nysed.gov/profile.php?instid=800000050065 https://data.nysed.gov/archive.php?instid=800000050065 Rochester, New York: Families with Food Stamp/SNAP benefits (57.4%), Parents (of children in Government school) not in the labor force (25.6%), Children in Government School living w/ a married couple (24.5%) & Children in Government School living in a single parent household (64.1%) Do you think perhaps the number of fragmented households is the reason this city is a wreck? Do you think that can be pinned on racism or irresponsibility? Is #whitesurpremacy causing that or just a lack of a moral compass?
https://data.nysed.gov/essa.php?instid=800000050065&year=2022&createreport=1&38ELA=1 https://data.nysed.gov/essa.php?instid=800000050065&year=2023&createreport=1&38ELA=1
https://data.nysed.gov/essa.php?instid=800000081568&year=2023&createreport=1&naep=1 NY’s statewide NAEP results (grade 8) indicate that Blacks & Hispanics (you know, the folks that Democrats care about) are lagging far behind Asians & Whites. ELLs are doing very poorly (you know, the people Joe Biden wants to invite into this country to vote his party into power for a generation, merit be damned), 83% of them are “below basic.” Story County, Iowa Supervisor Latifah Faisal also wants to invite thousands of illegal alien migrants into Iowa & specifically Story County, you’ll pay for it. She wants to destroy your communities w/ tent cities – she wants your hospitals overwhelmed & you get to pay for it.
https://data.nysed.gov/essa.php?instid=800000050065&year=2023&createreport=1&38ELA=1 https://data.nysed.gov/essa.php?instid=800000050065&year=2022&createreport=1&38ELA=1 Grade 8 ELA results for school years ending 2022 & 2023, 81.5% of Rochester students (statewide = 47%) are NOT proficient (Levels 1 & 2) in ELA. Nice job! 50% of Rochester students were stuck in Level One, statewide avg. was 18%.
For school years 2022 & 2023 (ELA, Grade 8) in Rochester, 66% of Asian students were NOT proficient (Levels 1 & 2), Blacks = 84.5% (!), White = 61%, Hispanic = 83.5% & ELLs = 97.5%
https://data.nysed.gov/essa.php?instid=800000081568&year=2022&createreport=1&38ELA=1 https://data.nysed.gov/essa.php?instid=800000081568&year=2023&createreport=1&38ELA=1 For school years 2022 & 2023 statewide (ELA, Grade 8), 55.5% of Blacks (Levels 1 & 2) were NOT proficient, Hispanic = 56%, Asian = 24.5%, White = 44% & ELL = 93%. 22.5% of Blacks & 23% of Hispanic pupils are stuck in Level One.
https://data.nysed.gov/assessment38.php?subject=ELA&year=2019&instid=800000050065 https://data.nysed.gov/assessment38.php?instid=800000050065&year=2019&subject=ELA&grades%5B%5D=8&prof24=0 In Rochester (school years ending 2018 & 2019), 88% of all students in all grades were NOT proficient (Levels 1 & 2) in ELA (84% of all students in Grade 8).
** I realize I should calculate the raw numbers & then the %, as the number of students may vary from year to year, but I am not going to do that, sorry. I doubt it will affect the end % a lot as most students are tested. Just letting you know I realized that sorry! **
In Rochester (school years 2018 & 2019), only 17.5% of Asian students (Grade 8) averaged “proficient” in ELA, Blacks = 9%, Whites = 23%, Hispanic = 9.5% & ELLs = 1%. https://data.nysed.gov/assessment38.php?subject=ELA&year=2019&state=yes Here’s the data for NY statewide for those years, you can see Asians are way ahead of Whites, which are way ahead of ELLs, Black & Hispanic students. It’s either #whitesupremacy and/or a corrupt, ineffective government school system & poor home environment.
https://data.nysed.gov/essa.php?instid=800000050065&year=2023&createreport=1&EMchronic=1 https://data.nysed.gov/essa.php?instid=800000050065&year=2022&createreport=1&EMchronic=1 Chronic Absenteeism, school years 2022 & 2023 in Rochester, 61.75% of all students had that affliction. Asians (36.3%, that’s not good either) are chronically absent far less than Whites (47.55%), which are absent far less than Blacks (59.05%), Hispanics (71.25%) & ELLs (61.9%). Here’s the statewide data, same story different state. https://data.nysed.gov/essa.php?instid=800000081568&year=2023&createreport=1&EMchronic=1 https://data.nysed.gov/essa.php?instid=800000081568&year=2022&createreport=1&EMchronic=1 Why are “students of color” having such a difficult time getting in the door & how much of their ELA issues can be attributed to not showing up & how much can be pointed at ineffective, child groomer Government Schools? Timmy may not be able to read because his teachers are more interested in turning him into a homosexual & talking to him about oral sex. Only a pedophile/groomer would talk to a stranger’s kid about sex or try to open him up to homosexuality. The birds & the bees talk has always been a parent/guardian task. I digress.
https://data.nysed.gov/essa.php?instid=800000050065&year=2019&createreport=1&EMchronic=1 https://data.nysed.gov/essa.php?instid=800000050065&year=2018&createreport=1&EMchronic=1 https://data.nysed.gov/essa.php?instid=800000081568&year=2018&createreport=1&EMchronic=1 https://data.nysed.gov/essa.php?instid=800000081568&year=2019&createreport=1&EMchronic=1 Chronic absenteeism in Rochester & The Empire State has spiked since the dawn of the COVID-19 plandemic shutdowns (relative to 2018 & 2019 school years), where some schools for were closed years to in-person instruction. This caused millions of students to just disappear and/or show up for school only occasionally. States like NY went hog wild on this.
You’ll also notice “students of color” (the ones Democrats care about, cough) are leading the way in chronic absence, Asians are doing the best. I wonder why?
https://data.nysed.gov/gradrate.php?year=2023&instid=800000050065 https://data.nysed.gov/gradrate.php?year=2022&instid=800000050065 https://data.nysed.gov/gradrate.php?year=2018&instid=800000050065 https://data.nysed.gov/gradrate.php?year=2019&instid=800000050065 School years ending 2022 & 2023, 69% of all Rochester pupils (statewide = 86.5%) graduated on time. School years 2018 & 2019, it was 61% (statewide = 83%). Tell me how Reading Proficiency can barely budge in Rochester, chronic absenteeism can spike & yet, the 4-Year Graduation Rate went up?
https://data.nysed.gov/ell.php?year=2023&instid=800000050065 https://data.nysed.gov/ell.php?year=2023&state=yes Rochester City Government School District has 1,649 “newcomers” in the ELL category (the state has 182,810), that’s Regressive vernacular for illegal alien that they’ve invited into the school system to divert resources to. Some of these government schools are just house organs for the Democrat Party, the Party of Open Borders & an anti-meritocracy.
If you’ve read all my material, you may remember Rochester was pushing the Black Lives Matter agenda to school children, brainwashing them. Maybe that’s why much of their Student Body is not ready for the real world. Democrats don’t care, they just want to create SJW zombies. No sane person, if they could hand pick the school their child goes to would pick Rochester – it would be near the bottom of the list, period.
There are a lot of Hispanic & Black parents that would like some school choice, the Democrats will oppose that. Maybe that’s why some of them are fleeing the Democrat Party?
Do you think Rochester’s sky-high % of parents not in the labor force will go up or down if Joe Biden & Latifah Faisal get their way & import the 3rd world to America? We have meritorious immigration for a reason. Latifah Faisal & Joe Biden want more voters, an expanded permanent underclass, but not a larger labor force. NY is ground zero for this crap (among other things) & that’s why it is deteriorating rapidly. Get on the stick America!
People are fleeing New York City & the state, last one out shut off the lights. Rochester City is 19.7% Hispanic & 37.9% Black, the Student Body is 36.3% Black & 18.7% Hispanic.
https://nces.ed.gov/Programs/Edge/ACSDashboard/3605850 https://nces.ed.gov/ccd/districtsearch/district_detail.asp?Search=2&ID2=3605850 https://data.nysed.gov/profile.php?instid=800000052968 Buffalo, NY: Families with Food Stamp/SNAP benefits (51.5%), Parents (of children in Government school) not in the labor force (26.2%), Children in Government School living w/ a married couple (38.2%) & Children in Government School living in a single parent household (51.7%)
https://data.nysed.gov/essa.php?instid=800000052968&year=2022&createreport=1&38ELA=1 https://data.nysed.gov/essa.php?instid=800000052968&year=2023&createreport=1&38ELA=1 Grade 8 ELA results (school years ending 2022 & 2023) in Buffalo, 70% of all students on avg. were NOT proficient, 38% are stuck on Level One.
79% of Blacks (45% Level One) in Buffalo were NOT proficient in ELA (Grade 8), 83% of Hispanics (47.5% Level One), 48% of Asians (23.5% Level One), 52% of Whites (23.5% Level One) & a staggering 96.5% of ELLs (68.5% Level One).
https://data.nysed.gov/assessment38.php?subject=ELA&year=2019&instid=800000052968 https://data.nysed.gov/assessment38.php?instid=800000052968&year=2019&subject=ELA&grades%5B%5D=8&prof24=0 Grade 3-8 ELA results (school years ending 2018 & 2019), 47% of all students are in Level One & 76% are NOT proficient.
Grade 8, 41% of all Buffalo students are in Level One, 74% of all students are NOT proficient. 60% of Asians (30.5% Level One) are not proficient, 55% of Whites (27% Level One), 83.5% of Hispanics (49% Level One), 82.5% of Blacks (47% Level One) & 98% of ELLs were NOT proficient (74% Level One) in ELA. Nice Job Buffalo Government Schools! Wonder why this area votes >75% Dumocrat?
https://data.nysed.gov/essa.php?instid=800000052968&year=2023&createreport=1&HSchronic=1 https://data.nysed.gov/essa.php?instid=800000052968&year=2022&createreport=1&HSchronic=1 Chronic absenteeism (school years 2022 & 2023) is a YUUUGE problem in Buffalo & it’s the Ku Klux Klan’s fault! 76.45% of all Buffalo students on avg. were chronically absent!! Every race, every category saw rates well over 50%, nobody is doing well. Blacks were chronically absent 79.4% of the time, Hispanics = 86.15%.
https://data.nysed.gov/essa.php?instid=800000052968&year=2018&createreport=1&HSchronic=1 https://data.nysed.gov/essa.php?instid=800000052968&year=2019&createreport=1&HSchronic=1 Chronic absenteeism in Buffalo, school years ending 2018 & 2019: 49.15% of all students chronically absent on avg., Blacks (48.95%) & Hispanics (62.15%) were the highest. 46.2% of ELLs were chronically absent, they can’t even get in the door & Biden wants to dump them all over the country. COVID lockdowns were a disaster for Government schools, but the Democrats do not care how many marginal students were destroyed, so long as they register to vote & play the victim. They did this on purpose.
https://data.nysed.gov/gradrate.php?year=2023&instid=800000052968 https://data.nysed.gov/gradrate.php?year=2022&instid=800000052968 Buffalo 4-Year Graduation Rates (school years 2022 & 2023) were 79%, despite that massive chronic absentee problem & most of the student body failing reading comprehension.
78.5% of Blacks graduated on time, 70.5% of Hispanics, 90% of Asians, 81% of Whites & 70% of ELLs somehow managed to get a HS diploma in 4 years.
https://data.nysed.gov/gradrate.php?year=2019&instid=800000052968 https://data.nysed.gov/gradrate.php?year=2018&instid=800000052968 Buffalo 4-Year Graduation Rate, school years ending 2018 & 2019 was 64.5%. How can we see that much improvement in 2022 & 2023 when far more kids are chronically absent & half the children are at the bottom in Reading?
62% of Blacks graduated on time, 54.5% of Hispanics, 75% of Whites, 72.5% of Asians & 37% of ELLs. Not good & it’s quite obvious the Buffalo Government School System is failing “students of color,” Next!
Buffalo City is 12.3% Hispanic & 33.2% Black, the Student Body (and I am using NCES rolling avg. data) is 32.3% Black & 12.2% Hispanic.
https://nces.ed.gov/ccd/districtsearch/district_detail.asp?Search=2&ID2=2400090 https://nces.ed.gov/Programs/Edge/ACSDashboard/2400090 https://reportcard.msde.maryland.gov/ https://reportcard.msde.maryland.gov/Graphs/#/Assessments/ElaPerformance/3ELA/3/6/3/1/30/XXXX/2023 Baltimore, Maryland: Families with Food Stamp/SNAP benefits (47%), Parents (of children in Government school) not in the labor force (20.1%), Children in Government School living w/ a married couple (30.8%) & Children in Government School living in a single parent household (58.9%)
https://reportcard.msde.maryland.gov/Graphs/#/Assessments/ElaPerformance/10ELA/10/6/3/1/30/XXXX/2023 https://reportcard.msde.maryland.gov/Graphs/#/Assessments/ElaPerformance/10ELA/10/6/3/1/30/XXXX/2022 English 10 (ELA) results in Baltimore (year 2023) indicate only 31.2% of all students are proficient (13.9% in PL One), statewide it was 53.5%. In 2022, only 34% of Baltimore students were proficient (16.8% are in PL One), it was 53.4% statewide.
https://reportcard.msde.maryland.gov/Graphs/#/Assessments/ElaPerformance/1EL/10/6/3/1/30/XXXX/2019 https://reportcard.msde.maryland.gov/Graphs/#/Assessments/ElaPerformance/1EL/10/6/3/1/30/XXXX/2018 In 2019, only 16% of the District’s students (48.4% in PL One) were proficient, in 2018 only 13.8% of Baltimore pupils were proficient (52.1% on Performance Level One).
https://reportcard.msde.maryland.gov/Graphs/#/Assessments/ElaPerformance/10ELA/10/10/3/1/30/XXXX/2023 https://reportcard.msde.maryland.gov/Graphs/#/Assessments/ElaPerformance/10ELA/10/10/3/1/30/XXXX/2022 In 2023, only 29.1% of Black students in Baltimore City were proficient (13.2% in PL One) in English 10 & in 2022 it was a paltry 32.8% (16% in PL One).
https://reportcard.msde.maryland.gov/Graphs/#/Assessments/ElaPerformance/1EL/10/10/3/1/30/XXXX/2019 https://reportcard.msde.maryland.gov/Graphs/#/Assessments/ElaPerformance/1EL/10/10/3/1/30/XXXX/2018 In 2019, only 13.8% of Black pupils in Baltimore were proficient (49.1% in PL One) & in 2018 it was 11% (53.7% in PL One).
https://reportcard.msde.maryland.gov/Graphs/#/Assessments/NAEPResults/1RE/8/99/XXXX/2022 Maryland NAEP results in Reading (Grade 8) indicate many “students of color” (46% of Blacks & 43% of Hispanics) are below basic. Why are 63% of Asians proficient or better, only 18% of Blacks & 20% of Hispanics? Racism? Bad government schools? Bad home environment? Bell Curve? 77% of ELLs in MD are “below basic”, only 3% proficient or better.
https://reportcard.msde.maryland.gov/Graphs/#/ReportCards/ReportCardSchool/1/E/1/30/XXXX/2023 https://reportcard.msde.maryland.gov/Graphs/#/ReportCards/ReportCardSchool/1/E/1/30/XXXX/2022 https://reportcard.msde.maryland.gov/Graphs/#/ReportCards/ReportCardSchool/1/E/1/30/XXXX/2019 https://reportcard.msde.maryland.gov/Graphs/#/ReportCards/ReportCardSchool/1/E/1/30/XXXX/2018 In 2023 & 2022 on avg., only 72.18% of all Baltimore pupils graduated in 5 years! For school years ending 2018 & 2019, the average was 74.9%.
73.92% of Blacks (school years 2022 & 2023) graduated in 5 years, Asian = 91.23%, Hispanic = 56.69%, White = 76.73% & ELLs = 45.43%.
76.39% of Blacks (school years ending 2018 & 2019) graduated in 5 years, Asian = 92.55%, Hispanic = 57.3%, White = 72.89% & ELLs = 50.62%. How can a lower % of Blacks graduate in 2022-23 than 2018-19, YET in the latter time frame over half of Blacks overall were “below basic” (PL One) in Reading? Much higher than the former time frame. I realize Reading is only part of the equation (along w/ Math, pun intended), but it is the most important. Just found that odd.
Baltimore City Government Schools are used to a big chunk of the Student Body failing to show up for school. The COVID plandemic lockdowns did massive damage https://foxbaltimore.com/news/project-baltimore/education-crisis-58-of-baltimore-city-students-considered-chronically-absent https://www.baltimoresun.com/2018/06/06/nearly-1-in-5-maryland-students-is-chronically-absent-at-some-schools-the-rate-is-more-than-75-percent/ https://www.wypr.org/wypr-news/2024-01-19/chronic-absenteeism-real-concern-maryland-lawmakers-educators-aim-to-address
Conclusion: Baltimore sucks! Baltimore City is 5.9% Hispanic & 61.2% Black, the Student Body is 60.9% Black & 6% Hispanic.
https://nces.ed.gov/Programs/Edge/ACSDashboard/1001240 https://nces.ed.gov/ccd/districtsearch/district_detail.asp?Search=2&ID2=1001240 https://reportcard.doe.k12.de.us/detail.html#aboutpage?scope=district&district=31&school=0 Wilmington, Delaware, home of Kid Sniffer Joe Biden who showered w/ his own daughter: Families with Food Stamp/SNAP benefits (13.4%), Parents (of children in Government school) not in the labor force (12.4%), Children in Government School living w/ a married couple (58.1%) & Children in Government School living in a single parent household (32.7%)
https://reportcard.doe.k12.de.us/detail.html#displaypage?scope=district&district=31&school=0&id=342 School years 2022 & 2023, 59% of the District’s (Brandywine, which Wilmington helms) pupils were “below basic” in ELA (state avg. = 58.5%). School years 2019 & 2021, 53.5% of the District’s pupils were “below basic” (State = 53%). Tried to load data for Race/Ethnicity, got a perpetual error. https://reportcard.doe.k12.de.us/detail.html#displaypage?scope=district&district=31&school=0&id=406 ELLs are struggling mightily in Brandywine.
https://reportcard.doe.k12.de.us/detail.html#displaypage?scope=district&district=31&school=0&id=340 You can bet the farm that if a high % of students are struggling in Reading/ELA, the % will be much higher for Math; Wilmington is no different.
https://reportcard.doe.k12.de.us/detail.html#displaypage?scope=state&district=0&school=0&id=351 https://archive.is/TrKoD NAEP Reading results in DE indicates that in 2022, 76% of kids were “below basic.” 2019 & 2017 it averaged 68% below basic. Bad Government Schools? Bad parents? Bad COVID lockdowns? Joe Biden showered with his daughter?
https://www.doe.k12.de.us/Page/506 https://www.doe.k12.de.us/site/handlers/filedownload.ashx?moduleinstanceid=725&dataid=24170&FileName=2019%20grade%204%20reading%20snapshot.pdf https://www.doe.k12.de.us/site/handlers/filedownload.ashx?moduleinstanceid=725&dataid=24169&FileName=2017%20grade%204%20reading%20snapshot.pdf Better DE NAEP results: 46% of Hispanics, 10% of Asians, 25% of Whites & 53% of Blacks (Grade 4 Reading 2019) were “below basic.” In 2017 (Reading, Grade 4), 43% of Hispanics were “below basic,” 46% of Blacks, 21% of Whites & only 10% of Asians. Same story, different year, Democrat-dominated state.
If you’re a walking vegetable that can barely read, are you more or less likely to believe the fecal matter Sam Seder is spewing from his sewer hole?
https://reportcard.doe.k12.de.us/detail.html#displaypage?scope=district&district=31&school=0&id=333 5-Year Graduation Rates are as follows: School years ending 2017-2019 = 86.4% for all students. School years ending 2020-2022 = 90.97% for all students. In school years ending 2018 & 2019 (all other data years are suppressed), Blacks graduated at an 82.37% clip.
https://reportcard.doe.k12.de.us/detail.html#displaypage?scope=district&district=31&school=0&id=395 School years ending 2022 & 2023, 22.08% of all students were chronically absent. School years ending 2019 to 2021, 15.71% of all students in the District were chronically absent. This is good compared to what we’ve seen so far.
https://archive.is/zMnOC Black students in school years ending 2019 & 2020 were chronically absent 17.3% of the time. School years 2021 through 2023 = 29.75% of the time. This is not nearly as bad as other Districts I’ve covered. The rate for Blacks is much higher than all other groups. Why? Racism? Bad Parents? Bad Government Schools? Sam Seder is a creepy old man that has a bi-polar fit when fat 30-year-old men cannot wear thongs and dance in front of 8-year-olds?
Wilmington City is 11.3% Hispanic & 53.7% Black, The Student Body is 23.3% Black & 3.9% Hispanic.
https://nces.ed.gov/Programs/Edge/ACSDashboard/3500060 https://nces.ed.gov/ccd/districtsearch/district_detail.asp?Search=2&ID2=3500060 https://webnew.ped.state.nm.us/bureaus/accountability/data/ https://webnew.ped.state.nm.us/bureaus/safe-healthy-schools/attendance-for-success/annual-state-districts-and-schools-attendance-report/ https://nmvistas.org/ https://nmvistas.org/Albuquerque_Public_Schools https://webnew.ped.state.nm.us/bureaus/accountability/accountability/ Albuquerque, New Mexico: Families with Food Stamp/SNAP benefits (25.9%), Parents (of children in Government school) not in the labor force (15.4%), Children in Government School living w/ a married couple (51.7%) & Children in Government School living in a single parent household (37.1%)
https://nmvistas.org/Albuquerque_Public_Schools#readingProficiency Not a lot of data (read through archived NAEP results if you want a better idea) here, they don’t have an area where I can access a lot of recent archived reports.
So, for what it’s worth, 59.6% of Albuquerque students are NOT proficient in Reading, 70% of Blacks, 67% of Hispanics, 59% of Whites, 43% of Asians, 76% of AI/AN & 84% of ELLs are NOT proficient in Reading for the most recent school year. They actually do better than NM statewide in many cases, only because the state is doing so poorly overall.
27.3% of all Albuquerque students are stuck in the lowest Reading Performance Level, 34.2% of Blacks, 18.8% of Asians, 45.6% of ELLs, 36.2% of AI/AN, 26.9% of Whites & 31.4% of Hispanics are on PL One.
https://nmvistas.org/Albuquerque_Public_Schools#regularAttendance 36.8% of all Albuquerque students suffer from “Chronic Absenteeism.” 40% of Hispanics, 41% of ELLs, 36.2% of Whites, 25.2% of Asians, 47.9% of AI/AN & 100% of “Migrant” students last school year were chronically absent. https://nmvistas.org/Albuquerque_Public_Schools#englishLearningProgress That is probably much of the reason (aside from a broken, ineffective Government School System) they can’t read.
https://nmvistas.org/Albuquerque_Public_Schools#graduationGrowth School year 2022-23, only 82% of students graduated in 5 years. 95% of Asians, 75% of Blacks, 81% of Hispanics, 88% of Whites, 75% of AI/AN & somehow, 81% of ELLs managed to graduate in 5 years.
https://webed.ped.state.nm.us/sites/conference/2018%20District%20Report%20Cards/001_ALBUQUERQUE_PUBLIC_SCHOOLS_DRC2018_.pdf Pertaining to school year 2018 in Albuquerque, 63% (p.5) of the entire student body was not proficient in Reading. 44% of Whites, 69% of Blacks, 70% of Hispanics, 41% of Asians, 74% of AI/AN & 82% of ELLs are NOT proficient in Reading.
Only 73% of Albuquerque students graduated in 5 years. 79% of Whites, 62% of Blacks, 72% of Hispanics, 85% of Asians, 57% of AI/AN & 70% of ELLs graduated in 5 years.
https://webed.ped.state.nm.us/sites/conference/2017%20District%20Report%20Cards/001_ALBUQUERQUE_PUBLIC_SCHOOLS_DRC2017_.pdf In 2017, 66% of the Student Body (p.4) was NOT proficient in Reading; 47% of Whites, 71% of Blacks, 43% of Asians, 76% of AI/AN, 72% of Hispanics & 85% of ELLs were NOT proficient in Reading. Indian children are getting a quality government education in NM that Barack Obama would be proud of.
Yet, 71% of all Albuquerque pupils graduated in 5 years; 75% of Whites, 62% of Blacks, 70% of Hispanics, 81% of Asians, 59% of AI/AN & 67% of ELLs graduated in 5 years.
You can look back at more school years if you’d like, you’ll see Albuquerque is one of the worst large government school districts in the nation, no wonder it overwhelmingly votes Dumocrat.
https://www.nationsreportcard.gov/profiles/stateprofile/overview/NM https://nmeducation.org/new-mexico-ranks-dead-last-nationally-on-naep-test-results/ https://nces.ed.gov/nationsreportcard/subject/publications/stt2022/pdf/2023010NM8.pdf New Mexico’s NAEP results are a prime example of Government School failures. 48% of Hispanics & 53% of AI/AN students are below basic in Reading (Grade 8).
Albuquerque City is 49.8% Hispanic & 3.2% Black, the Student Body is 2.4% Black & 50.4% Hispanic.
https://nces.ed.gov/Programs/Edge/ACSDashboard/2201170 https://nces.ed.gov/ccd/districtsearch/district_detail.asp?Search=2&ID2=2201170 https://louisianabelieves.com/data/reportcards/ https://app.powerbi.com/view?r=eyJrIjoiMDc4YWM2OTctYjY2Ny00MjIzLWIwYTMtNmVmOTI5MGE1NWVmIiwidCI6ImQ0ZTcxMTI3LWVlZWQtNDZlZi1hY2JkLTA0MDgyZjdmYmE0MCJ9 New Orleans/Orleans Parish, Louisiana: Families with Food Stamp/SNAP benefits (37.5%), Parents (of children in Government school) not in the labor force (19.2%), Children in Government School living w/ a married couple (33.5%) & Children in Government School living in a single parent household (57.8%)
I tried to pull up LEA reports for Orleans Parish & kept getting this “The school does not serve students in this grade level” B.S. I was able to pull up a report for school year 2020-21 (PDF) & it gave me results for 2018-19 because… COVID. The proficiency reports for all subjects, grades 3-8 in Orleans were N/A. Sorry, no good data for that District.
https://www.usnews.com/education/k12/louisiana/districts/orleans-parish-107396 https://nolapublicschools.com/news-blog/state-leap-scores-released-for-orleans-parish-results-show-impact-of-covid-19-pandemic-on-student-achievement https://pelicanpolicy.org/education/louisianas-2022-leap-scores-some-improvement-but-a-long-way-to-go/ https://www.nola.com/news/education/latest-louisiana-reading-report-remains-glum/article_b5a435b0-718c-11ed-b088-f740c3e8dec8.html https://www.theadvertiser.com/story/news/2022/09/01/louisiana-literacy-crisis-how-state-dealing-with-in-schools/65466120007/ However, many other venues report the lack of success Orleans Parish students are having in Reading, this has been an ongoing issue. The COVID plandemic did NOT affect student Reading & achievement, the lockdowns did you clowns! Orleans Parish is typically near the bottom.
https://www.nationsreportcard.gov/profiles/stateprofile/overview/LA https://nces.ed.gov/nationsreportcard/subject/publications/stt2022/pdf/2023010LA8.pdf LA NAEP results paint a bleak picture, 48% of Blacks & 36% of Hispanics are “Below Basic” in Reading, Grade 8 (2022). In 2019, 48% of Blacks & 32% of Hispanics were “Below Basic” in Reading (Grade 8).
Orleans Parish is 58.6% Black & 5.9% Hispanic; the Student Body is 6% Hispanic & 58% Black.
https://nces.ed.gov/ccd/districtsearch/district_detail.asp?Search=2&ID2=2200540 https://nces.ed.gov/Programs/Edge/ACSDashboard/2200540 Baton Rouge, LA: Families with Food Stamp/SNAP benefits (38.6%), Parents (of children in Government school) not in the labor force (17.7%), Children in Government School living w/ a married couple (40%) & Children in Government School living in a single parent household (49%)
East Baton Rouge Parish, Grades 3-8 in ELA (school year 2023), 21% of the entire student body is “approaching basic” & 19% are “unsatisfactory.” Only 37% would be considered “proficient.” School year ending 2022 (Grades 308, ELA), 41% of all East Baton Rouge pupils are “below basic” & only 35% would be considered “proficient.”
School year ending 2021 (Grades 3-8, ELA), 42% of all students are “below basic”, only 34% are “proficient” or better.
44% of Black students (school years ending 2021, 2022 & 2023) on average were “below basic” in ELA (grades 3-8), only 29.3% are considered “proficient” or better. 57% of Hispanic students in that time frame were “below basic” in ELA, only 24.6% were “proficient” or better.
School years ending 2021-2023, the overall graduation rate for East Baton Rouge Parish = 74.43%, much lower than the statewide rate of 83.4%. During that same time period in East Baton Rouge Parish, only 74.66% of Blacks graduated on time, 52.9% of Hispanics (the ELL rate is much, much lower), 83% of Whites & 93.2% (one year was simply >95, which means it could be 98% or 95.2%) of Asians. All groups save Asians do worse in East Baton Rouge compared to statewide.
Baton Rouge City is 4.4% Hispanic & 52.5% Black, the Student Body (East Baton Rouge parish School District) is 4.6% Hispanic & 73.6% Black.
https://nces.ed.gov/ccd/districtsearch/district_detail.asp?Search=2&ID2=1930480 https://nces.ed.gov/Programs/Edge/ACSDashboard/1930480 https://www.iaschoolperformance.gov/ECP/Home/Index https://www.iaschoolperformance.gov/ECP/StateDistrictSchool/DistrictSummary?k=8844&y=2023 Waterloo, (the murder capital of) Iowa: Families with Food Stamp/SNAP benefits (35.8%), Parents (of children in Government school) not in the labor force (14.1%), Children in Government School living w/ a married couple (45.4%) & Children in Government School living in a single parent household (37.9%)
https://www.iaschoolperformance.gov/ECP/StateDistrictSchool/DistrictDetails?DetailType=Proficiency&DataDisplayType=Accountability&k=8844&y=2023 https://www.iaschoolperformance.gov/ECP/StateDistrictSchool/DistrictDetails?DetailType=Proficiency&k=8517&y=2022 https://www.iaschoolperformance.gov/ECP/StateDistrictSchool/DistrictDetails?DetailType=Proficiency&k=8190&y=2021 (I post lots of links because they may be hard to find years from now & I can archive them, if possible) ELA proficiency (school years ending 2021-23) in Waterloo, only 57.61% of all students on average were “proficient” (statewide = 70.39%).
ELA proficiency in Waterloo, school years ending 2018 & 2019 = 59.61% (statewide = 73.42%).
ELA proficiency in Waterloo, school years ending 2021-23: 38.92% of Blacks were “proficient,” 71.49% of Asians, Hispanic = 55.65%, White = 69.8% & ELLs = 20.59%. This is why Democrats want open borders, they don’t want Asians w/ Engineering degrees, they don’t want meritorious immigration, they want the third world so they can wreck your District, sign them up for welfare & sign them up to vote.
Statewide averages for the groups above in ELA proficiency (school years 2021-23): Blacks = 41.77%, Asian = 77.88%, White = 75.22%, Hispanic = 55.96% & ELLs = 21.02%. Hispanics & ELLs do poorly statewide as well. Waterloo lags behind the state in just about every metric.
https://www.iaschoolperformance.gov/ECP/StateDistrictSchool/DistrictDetails?DetailType=CAB&k=8844&y=2023 Chronic Absenteeism in Waterloo (school years ending 2021-23), 33.9% of all students were chronically absent (statewide = 20.96%).
Chronic Absenteeism in Waterloo by race (school years 201-23): 44.53% of Blacks were chronically absent, Hispanic = 34.2%, Asian = 18.16%, White = 25.46% & ELLs = 31.8%. This explains a lot when it comes to ELA proficiency. You will not be proficient if you do not show up to school & again it’s not “racisms” (as The Salty Cracker would say) that’s causing it, it’s a home environment that is not positive.
Statewide Chronic Absenteeism by race (school years 2021-23): Blacks = 40.5%, Hispanic = 31.06%, White = 16.93%, Asian = 14.5% & ELLs = 31.1%.
Chronic Absenteeism in Waterloo, school years 2018 & 2019 = 21.9% (Statewide = 11.45%). You can see post-COVID plandemic (and Iowa did not engage in lockdown mania, but Reynolds had to fight the Democrats to open up all schools in the Spring of 2021, they wanted them shut longer), more kids are missing a lot of school.
https://www.iaschoolperformance.gov/ECP/StateDistrictSchool/DistrictDetails?DetailType=Civil%20Rights%20Data&k=8517&y=2022 https://www.iaschoolperformance.gov/ECP/StateDistrictSchool/DistrictDetails?DetailType=Civil%20Rights%20Data&k=7636&y=2019 For the 2 years we have data on violence in Waterloo, the arrestees tend to be male (136 of 251, 54.18%) & they also tend to be Black (189 of 251, 75.29%).
https://www.iaschoolperformance.gov/ECP/StateDistrictSchool/StateDetails?DetailType=Civil%20Rights%20Data&y=2019 https://www.iaschoolperformance.gov/ECP/StateDistrictSchool/StateDetails?DetailType=Civil%20Rights%20Data&y=2022 Statewide, of the 2,296 arrestees, 64.11% (1,472) of them were male & 30.48% (700) were Black. Iowa is 4-5% Black.
https://www.iaschoolperformance.gov/ECP/StateDistrictSchool/DistrictDetails?DetailType=Percent%20Students%20Expension&k=8844&y=2023 https://www.iaschoolperformance.gov/ECP/StateDistrictSchool/DistrictDetails?DetailType=Percent%20Students%20Expension&k=8517&y=2022 https://www.iaschoolperformance.gov/ECP/StateDistrictSchool/DistrictDetails?DetailType=Percent%20Students%20Expension&k=8190&y=2021 Of the 7,258 students suspended or expelled in Waterloo, 67.37% (4,890) were male & (3,609) 49.72% were Black.
https://www.iaschoolperformance.gov/ECP/StateDistrictSchool/DistrictSummary?k=8844&y=2023 https://www.iaschoolperformance.gov/ECP/StateDistrictSchool/DistrictSummary?k=8517&y=2022 https://www.iaschoolperformance.gov/ECP/StateDistrictSchool/DistrictSummary?k=8190&y=2021 School years ending 2021-23, 81.5% of all Waterloo pupils graduated on time (statewide = 90.6%).
https://www.iaschoolperformance.gov/ECP/StateDistrictSchool/DistrictSummary?k=7636&y=2019 https://www.iaschoolperformance.gov/ECP/StateDistrictSchool/DistrictSummary?k=7306&y=2018 School years ending 2018 & 2019, 84.19% of all Waterloo pupils graduated on time (statewide = 91.19%).
In Waterloo (school years ending 2021 through 2023), 79.7% of Blacks graduated on time, Hispanic = 77.96%, White = (two years had the EXACT same numbers) 84.92%, Asian = 84.74% & ELLs = 83.79%.
Statewide (school years ending 2021 through 2023), 78.58% of Blacks graduated on time, Asian = 93.18%, White = 93.02%, Hispanic = 82% & ELLs = 75.22%.
Waterloo City is 7.1% Hispanic & 17.7% Black, The Student Body is 12.1% Hispanic & 22.9% Black.
That concludes this section where I covered a lot of Democrat-leaning dungholes that are rife w/. crime & found that in most cases, their government schools were also a train wreck, full of bad teachers & lots of kids that have a dysfunctional home life & if they do get to school, they don’t do well.
This is what Sam Seder & Latifah Faisal want, the more dysfunctional the child, the more likely they vote Demonrat.
***
Now for a slew of rural school districts in Western Iowa, featuring counties that have not voted for the Dumbasscrat nominee for POTUS since FDR or LBJ wrecked the country.
https://nces.ed.gov/ccd/districtsearch/district_detail.asp?Search=2&ID2=1918840 https://nces.ed.gov/Programs/Edge/ACSDashboard/1918840 MOC-Floyd Valley Community School District, Orange City, Iowa: Families with Food Stamp/SNAP benefits (7.4%), Parents (of children in Government school) not in the labor force (2.2%), Children in Government School living w/ a married couple (91.1%) & Children in Government School living in a single parent household (8.1%)
Compare those metrics above w/ the bevy of train wreck school districts I covered where Democrats win on a regular basis. Tell me which one is better & why. There are other metrics on those pages that I did not specifically mention, such as % of the population that finished high school or above that threshold. Everything on here is archived https://archive.is/ https://web.archive.org/ Look at the % of parents of children in Government Schools that are in the labor force compared to say, Chicago, St. Louis, Los Angeles. Also compare the % of the population of the school district that has a high school diploma or better, as well as the % of the population that owns their own home, compared to these Democrat-run dungholes.
https://nces.ed.gov/Programs/Edge/ACSDashboard/1916530 https://nces.ed.gov/ccd/districtsearch/district_detail.asp?Search=2&ID2=1916530 Le Mars, Iowa: Families with Food Stamp/SNAP benefits (8%), Parents (of children in Government school) not in the labor force (8.2%), Children in Government School living w/ a married couple (79.6%) & Children in Government School living in a single parent household (14%)
https://nces.ed.gov/Programs/Edge/ACSDashboard/1915750 https://nces.ed.gov/ccd/districtsearch/district_detail.asp?Search=2&ID2=1915750 Kingsley-Pierson Community School District, Kingsley, Iowa: Families with Food Stamp/SNAP benefits (18.3%), Parents (of children in Government school) not in the labor force (3.4%), Children in Government School living w/ a married couple (74%) & Children in Government School living in a single parent household (20%)
*If you are wondering why some of the figures on the NCES page differ from what I have here, I clicked on the icons & got the exact data. They’re rounding. The NCES just did an update while I was polishing this off & now there seems to be a lot more variance. They changed from 2017-21 data to 2018-22 data. Sorry!*
https://nces.ed.gov/ccd/districtsearch/district_detail.asp?Search=2&ID2=1924120 https://nces.ed.gov/Programs/Edge/ACSDashboard/1924120 Remsen-Union Community School District, Remsen, Iowa: Families with Food Stamp/SNAP benefits (6.5%), Parents (of children in Government school) not in the labor force (9.2%), Children in Government School living w/ a married couple (76.6%) & Children in Government School living in a single parent household (6%)
https://nces.ed.gov/Programs/Edge/ACSDashboard/1912690 https://nces.ed.gov/ccd/districtsearch/district_detail.asp?Search=2&ID2=1912690 Glenwood Community School District, Glenwood, Iowa: Families with Food Stamp/SNAP benefits (14.3%), Parents (of children in Government school) not in the labor force (8.4%), Children in Government School living w/ a married couple (74.8%) & Children in Government School living in a single parent household (17%)
https://nces.ed.gov/ccd/districtsearch/district_detail.asp?Search=2&ID2=1913660 https://nces.ed.gov/Programs/Edge/ACSDashboard/1913660 Hartley-Melvin-Sanborn Community School District, Hartley, Iowa: Families with Food Stamp/SNAP benefits (12.5%), Parents (of children in Government school) not in the labor force (12.6%), Children in Government School living w/ a married couple (56.1%) & Children in Government School living in a single parent household (28%)
https://nces.ed.gov/Programs/Edge/ACSDashboard/1913500 https://nces.ed.gov/ccd/districtsearch/district_detail.asp?Search=2&ID2=1913500 Harlan, Iowa: Families with Food Stamp/SNAP benefits (9.4%), Parents (of children in Government school) not in the labor force (11.7%), Children in Government School living w/ a married couple (82.4%) & Children in Government School living in a single parent household (14.8%)
https://nces.ed.gov/Programs/Edge/ACSDashboard/1903930 https://nces.ed.gov/ccd/districtsearch/district_detail.asp?Search=2&ID2=1903930 Atlantic, Iowa: Families with Food Stamp/SNAP benefits (26.8%), Parents (of children in Government school) not in the labor force (12.8%), Children in Government School living w/ a married couple (64%) & Children in Government School living in a single parent household (30.3%)
https://nces.ed.gov/Programs/Edge/ACSDashboard/1913230 https://nces.ed.gov/ccd/districtsearch/district_detail.asp?Search=2&ID2=1913230 Griswold, IA: Families with Food Stamp/SNAP benefits (16.4%), Parents (of children in Government school) not in the labor force (6.5%), Children in Government School living w/ a married couple (70.2%) & Children in Government School living in a single parent household (15.4%)
https://nces.ed.gov/Programs/Edge/ACSDashboard/1906960 https://nces.ed.gov/ccd/districtsearch/district_detail.asp?Search=2&ID2=1906960 Rock Rapids, Iowa: Families with Food Stamp/SNAP benefits (3.7%), Parents (of children in Government school) not in the labor force (7.5%), Children in Government School living w/ a married couple (76.9%) & Children in Government School living in a single parent household (19.8%)
https://nces.ed.gov/Programs/Edge/ACSDashboard/1912480 https://nces.ed.gov/ccd/districtsearch/district_detail.asp?Search=2&ID2=1912480 George, Iowa: Families with Food Stamp/SNAP benefits (3.9%), Parents (of children in Government school) not in the labor force (4.1%), Children in Government School living w/ a married couple (77.8%) & Children in Government School living in a single parent household (21.6%)
https://nces.ed.gov/Programs/Edge/ACSDashboard/1925590 https://nces.ed.gov/ccd/districtsearch/district_detail.asp?Search=2&ID2=1925590 Sergeant Bluff, Iowa, IA: Families with Food Stamp/SNAP benefits (14.3%), Parents (of children in Government school) not in the labor force (11.5%), Children in Government School living w/ a married couple (68.1%) & Children in Government School living in a single parent household (24%)
https://nces.ed.gov/Programs/Edge/ACSDashboard/1931950 https://nces.ed.gov/ccd/districtsearch/district_detail.asp?Search=2&ID2=1931950 Moville, IA: Families with Food Stamp/SNAP benefits (5.8%), Parents (of children in Government school) not in the labor force (7.2%), Children in Government School living w/ a married couple (71.4%) & Children in Government School living in a single parent household (19%)
https://nces.ed.gov/ccd/districtsearch/district_detail.asp?Search=2&ID2=1927000 https://nces.ed.gov/Programs/Edge/ACSDashboard/1927000 Spirit Lake, IA: Families with Food Stamp/SNAP benefits (7.8%), Parents (of children in Government school) not in the labor force (3.8%), Children in Government School living w/ a married couple (77.9%) & Children in Government School living in a single parent household (16%)
https://nces.ed.gov/Programs/Edge/ACSDashboard/1916140 https://nces.ed.gov/ccd/districtsearch/district_detail.asp?Search=2&ID2=1916140 Lake Park, Iowa: Families with Food Stamp/SNAP benefits (6.3%), Parents (of children in Government school) not in the labor force (6.7%), Children in Government School living w/ a married couple (83.8%) & Children in Government School living in a single parent household (10.3%)
https://nces.ed.gov/Programs/Edge/ACSDashboard/1900021 https://nces.ed.gov/ccd/districtsearch/district_detail.asp?Search=2&ID2=1900021 Milford, IA: Families with Food Stamp/SNAP benefits (8.1%), Parents (of children in Government school) not in the labor force (2.5%), Children in Government School living w/ a married couple (68.8%) & Children in Government School living in a single parent household (28.5%)
https://nces.ed.gov/Programs/Edge/ACSDashboard/1912230 https://nces.ed.gov/ccd/districtsearch/district_detail.asp?Search=2&ID2=1912230 Galva-Holstein, Iowa: Families with Food Stamp/SNAP benefits (10.9%), Parents (of children in Government school) not in the labor force (1.2%), Children in Government School living w/ a married couple (61.5%) & Children in Government School living in a single parent household (17.5%)
https://nces.ed.gov/Programs/Edge/ACSDashboard/1912660 https://nces.ed.gov/ccd/districtsearch/district_detail.asp?Search=2&ID2=1912660 Gladbrook-Reinbeck, IA: Families with Food Stamp/SNAP benefits (11.8%), Parents (of children in Government school) not in the labor force (10.5%), Children in Government School living w/ a married couple (78.3%) & Children in Government School living in a single parent household (14.4%)
https://nces.ed.gov/Programs/Edge/ACSDashboard/1913290 https://nces.ed.gov/ccd/districtsearch/district_detail.asp?Search=2&ID2=1913290 Grundy Center, IA: Families with Food Stamp/SNAP benefits (8.2%), Parents (of children in Government school) not in the labor force (4.9%), Children in Government School living w/ a married couple (67%) & Children in Government School living in a single parent household (22.3%)
https://nces.ed.gov/ccd/districtsearch/district_detail.asp?Search=2&ID2=1909120 https://nces.ed.gov/Programs/Edge/ACSDashboard/1909120 Dike-New Hartford, IA: Families with Food Stamp/SNAP benefits (8.5%), Parents (of children in Government school) not in the labor force (8.8%), Children in Government School living w/ a married couple (90.3%) & Children in Government School living in a single parent household (6.3%)
https://nces.ed.gov/Programs/Edge/ACSDashboard/1903750 https://nces.ed.gov/ccd/districtsearch/district_detail.asp?Search=2&ID2=1903750 Aplington-Parkersburg, IA: Families with Food Stamp/SNAP benefits (15.3%), Parents (of children in Government school) not in the labor force (11.1%), Children in Government School living w/ a married couple (73%) & Children in Government School living in a single parent household (16.9%)
https://nces.ed.gov/ccd/districtsearch/district_detail.asp?Search=2&ID2=1907350 https://nces.ed.gov/Programs/Edge/ACSDashboard/1907350 Clarinda, IA: Families with Food Stamp/SNAP benefits (15.5%), Parents (of children in Government school) not in the labor force (9.7%), Children in Government School living w/ a married couple (77.8%) & Children in Government School living in a single parent household (16.1%)
https://nces.ed.gov/Programs/Edge/ACSDashboard/1929580 https://nces.ed.gov/ccd/districtsearch/district_detail.asp?Search=2&ID2=1929580 East Sac County, IA: Families with Food Stamp/SNAP benefits (10.5%), Parents (of children in Government school) not in the labor force (9.2%), Children in Government School living w/ a married couple (69.8%) & Children in Government School living in a single parent household (18.9%)
https://nces.ed.gov/Programs/Edge/ACSDashboard/1914370 https://nces.ed.gov/ccd/districtsearch/district_detail.asp?Search=2&ID2=1914370 Humboldt, IA: Families with Food Stamp/SNAP benefits (15.1%), Parents (of children in Government school) not in the labor force (10.6%), Children in Government School living w/ a married couple (68.3%) & Children in Government School living in a single parent household (21.1%)
Now I’ll close this section out by pointing out tese rural communities are anathema to the Dumbasscrats. They do NOT like this as it’s an affront to their attempts to nationalize everything.
They want a national curriculum, devoid of school choice because on their own, these tightly-knit communities (where most folks own property, not stuck in apartments, no offence to those who live in apartments) will not talk to little boys about oral sex or tell them they might like to try homosexuality or they can “change” their gender to XX. Sam Seder gets angry when strangers are prohibited from talking to 8-year-olds about incest or oral sex. The overweight Latifah Faisal (Story County, Iowa Supervisor) also has a bi-polar fit when little boys aren’t allowed to read books about cousins sucking on each other’s penis. Maybe she likes that & maybe that’s why she can’t find a man that will stick w/ her, but she won’t talk to my kid about that, will you fatty?
The Demoncrats want to hypersexualize your children & make them dysfunctional. No wonder these places prefer Republicans.
***
Here’s some more national & state data demonstrating the nagging, prevalent, perpetual achievement gap for “students of color” (in this case Black) in our nation’s vaunted public schools
https://www.nationsreportcard.gov/dashboards/achievement_gaps.aspx Is it racism causing the MAMMOTH gap between Asian/Pacific Islander & Black achievement? Or is it a better culture? Here’s the Asian & Black achievement gap in Reading for all government schools (gaps are 40, 38 & 36 points for Grades 4, 8 & 12). https://archive.ph/U4vR9 Asians are pulling away & doing well, Blacks are not. Racism? Bad Government Schools? Sam Seder is a creepy, fat old man?
Asian scores in the latter years were 238, 281 & 299. Black scores in the latter years were 198, 243 & 263.
Here’s the gap between Asian & Black achievement in Reading for Rural Public (Government) Schools (39, 41 & 37 points for Reading, Grades 4, 8 & 12). https://archive.is/9P1iA Still a YUUUGE gulf. Racism? Bigotry? Culture? Asian scores in the latter years were 241, 283 & 298. Black scores in the latter years were 202, 243 & 261.
Here’s the gap between Asian & Black achievement in Reading for “City” Government Schools. Those gaps are 39, 38 & 35 points for Grades 4, 8 & 12. https://archive.ph/fVJ51 Asian scores in the latter years were 233, 278 & 297. Black scores in the latter years were 194, 240 & 262. The gap persists, period.
Here’s the gap between Asians (238, 281 & 299 in latter years – 2022, 2022 & 2019) & Blacks (198, 242 & 263) nationally, All Government (Public) Schools, non-charters. https://archive.ph/O8ELD The latter year gaps were 40, 39 & 36.
How about the gap between White & Black achievement in all Government (Public) Schools? Those gaps are 28, 24 & 31 points (Reading, Grades 4, 8 & 12). https://archive.ph/5L5Al White scores in the latter years (2022, 2022 & 2019) were 226, 267 & 294. Black scores in the latter years were 198, 243 & 263.
Gap between White & Black achievement in Rural Government Schools: Those gaps are 20, 20 & 29 points in the latter years of each grade. https://archive.ph/YBWi7 White scores in the latter years were 222, 263 & 289. Black scores in the latter years were 202, 243 & 261.
Gap between White & Black achievement in “City” Government Schools: https://archive.is/8l9pU Those gaps are 37, 30 & 37. White scores in the latter years were 230, 270 & 299. Black scores in the latter years were 194, 240 & 262. https://www.facebook.com/permalink.php?story_fbid=pfbid0285ZZGanTN6msGaYnAxZm77efMFyFsv2GwNehjSVQ6i8Z6Xjk29mLseJg1SdHpPehl&id=100064869933577
How about the gap between Whites (scores of 226, 267 & 294 in 2022, 2022 & 2019) & Blacks (Scores of 198, 242 & 263) in All Government (Public) Schools, non-charters? https://archive.ph/m1YRf Gaps of 28, 25 & 31.
Look at the gap between Asians (latter year scores are 244 & 284) & Blacks (latter year scores are 194 & 245) for non-charter schools in Democrat-dominated California https://archive.is/pemK1 (I think they are rounding). Does everyone in California lose when they’re basically forced to attend a government brainwashing clinic? When creepy old man Sam Seder says people are “losing” in charter schools, what he means is they’re probably not being groomed by borderline pedophiles & they’re not having “gender reassignment” rammed down their throats.
We’re not debating whether 2+2 = 4, creepy old man Sam Seder, but what we are debating is you’re not going to talk to my child about mutilating their genitals & “transitioning” from XX to XY or vice-versa, which is biophysically impossible. You’re not going to talk to my child about sexual intercourse either, my wife & I will handle that, your wife probably took care of that after she booted your creepy carcass to the curb because you’re mentally ill.
Look at the gap between Asians (latter year scores are 233 & 277) & Blacks (latter year scores are 192 & 244) in super-duper Democrat New York State – non-charter schools. https://archive.ph/fEoUX Asians are a minority that are doing very well in these United States. Is there an implicit bias towards them or are they just productive people? FDR illegally & unconstitutionally put them in internment camps during WWII, can they cry about that for the next century & play the victimhood argument into perpetuity?
How about the non-charter school gap between Asians & Black in the sad state of Illinois? https://archive.ph/suPAJ Racism causing that? Democrats have had a stranglehold on the legislature there for a very long time. Asian scores for Grades 4 & 8 (latter years) were 249 & 288. Black scores were 194 & 241.
How about non-charter schools in Texas? https://archive.is/2Fury Asians scored (again, latter years) 249 & 285, Blacks scored 205 & 247. I could do this all day, the gap is persistent, the gap is large in Government schools across the country, it’s large in Government schools, whether they are rural or urban.
The gap is large in Government schools across the nation that are not charters as well. Creepy old man #samseder #majorityreport opposes charter schools, private schools – anything that is not ordained by the Communist/Collectivist Bloc because they want to nationalize it, along w/ everything else they can & they want “gender identity” as part of the curriculum early on so your kids can become open to that.
Under normal circumstances, they won’t embrace that. Just as Hitler’s regime brainwashed the youth into Nazi Fascism (which was very friendly to nationalization of industry, much like the modern Democrat Party), Sam Seder & his groomer cronies want to hypersexualize your children.
If Sam Seder had lived in 1960s East Germany, he would’ve been a snitch for the Stasi. Not a heavy, because that would require him to lose some weight & estrogen – he would’ve been throwing flowers at a reviewing stand, doing his best “for the state.”
If Black Children lived in a 2-parent home & their kids made it to school regularly, along w/ school choice (allowing them to remove their kids from these dropout factories), much of the gap between Black & White, as well as Black & Asian achievement would vanish.
The Democrats do not want that though, as their base is the permanent underclass. The Democrats do not want these ventures for “Students of Color” because in that case, they might start to walk off the Leninist Plantation.
Donald J. Trump & the GOP should make national school choice & a shuttering of the Federal Dept. of Education their top priority in 2025. Squeaky wheel gets the grease. America could also use more fathers in the home, that would help. Mr. Chairman, I Yield Back.
-
 2:18:29
Badlands Media
13 hours agoDevolution Power Hour Ep. 376: Optics, Explosions & the War for the Narrative
138K38 -
 37:46
37:46
Stephen Gardner
11 hours ago🔥Trump NEVER expected THIS WIN as Schumer has EPIC MELTDOWN!
39.2K37 -
 2:02:41
Inverted World Live
7 hours agoNASA Engineer Says Trillions of Shape-Shifting, Cloaked Devices are Hidden on Earth| Ep. 83
33.4K10 -
 3:12:37
TimcastIRL
8 hours agoGOP Councilman DOUSED IN GAS, Set ON FIRE In Virginia, Suspect In Custody | Timcast IRL
244K88 -
 2:32:23
The Quartering
7 hours agoOn To The Big Bosses! Act 2 Of Expedition 33
60.5K6 -
 7:36:34
SpartakusLIVE
9 hours agoTiger Blood RESTOCKED and 30% off w/ code SPARTAKUS30
85.5K -
 24:58
24:58
Law&Crime
10 hours ago $3.24 earnedSecond Note Leaves Disturbing Clues in New York City Killings
38.9K12 -
 1:36:57
Badlands Media
1 day agoAltered State S3 Ep. 39: Earthquakes, Energy Games & the Fall of the Narrative
76.1K16 -
 2:04:07
Due Dissidence
15 hours agoCharlie Kirk's GAZA LIES, Caitlin Clark Stalker, Palantir Goes Hollywood - w/ Kyle Matovcik | TMWS
41.3K10 -
 2:54:43
I_Came_With_Fire_Podcast
16 hours agoAmerica First, Trump Threatens China, Your Friendly Neighborhood Illegal, EPA Gets a "W"
39.6K15