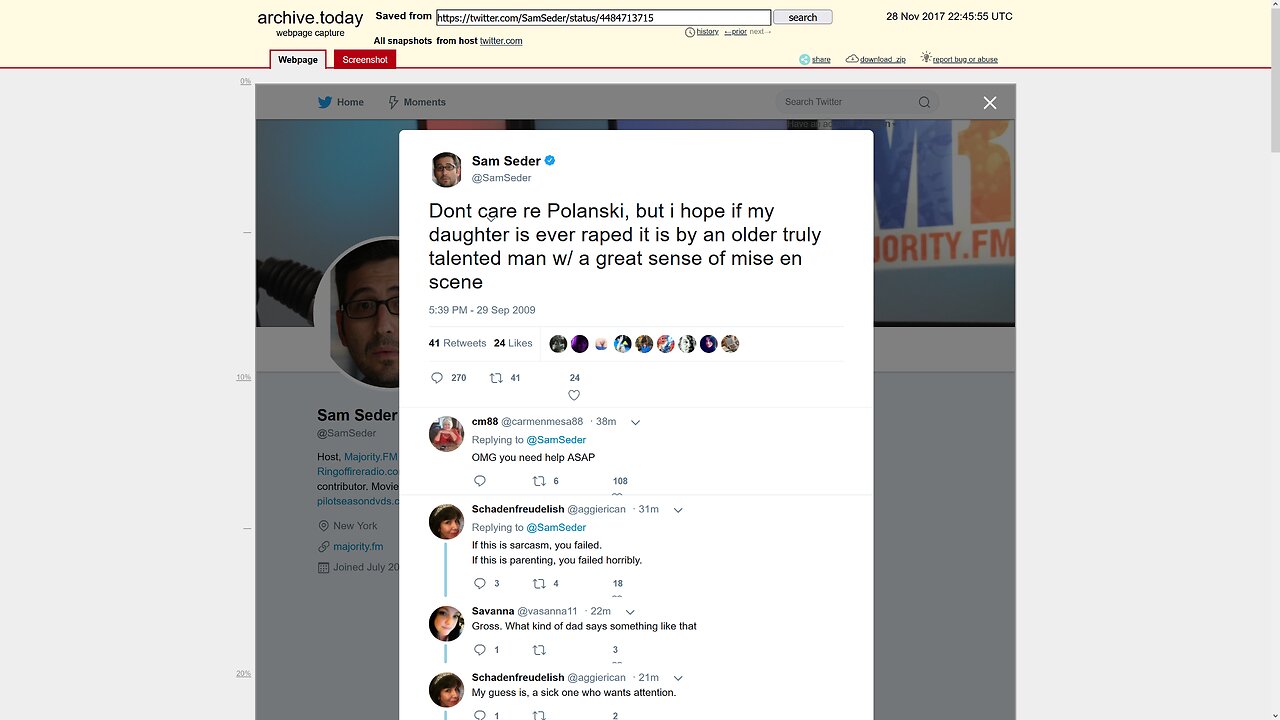
Creepy old man Sam Seder hates charter schools Part II
Chronic Absenteeism by race (Inglewood, school years ending 2022 & 2023): Blacks = 46.855%, Hispanic = 44.25%, Asian = 46.05%, (White & Filipino not enough students) Pacific Islander = 59.45% & ELLs = 43.25%
Chronic Absenteeism by race (school years ending 2018 & 2019): Blacks = 20.6%, Hispanic = 16.6%, (Asian, Filipino & Pacific Islander not enough students) White = 22.15% & ELLs = 15.5%. Look at those spikes in 2022 & 2023 because of lockdowns, shameful.
ELA achievement (or lack thereof) for school years ending 2022 & 2023, Districtwide they were 62.1 points BELOW standard. For schools years ending 2018 & 2019, they were 54.1 points BELOW standard. Well done!
ELA achievement by race for school years ending 2018 & 2019: Blacks = 63.1 points BELOW standard, Hispanic = 50.35 points below & ELLs (other groups not sufficiently represented) = 64.55 points below standard.
ELA achievement by race for school years ending 2022 & 2023: Blacks = 68.4 points BELOW standard, Hispanic = 60.7 points below standard & ELLs = 84.15 points below standard. Joe Biden & Story County, Iowa Supervisor & resident Hobbit Latifah Faisal want to bring millions more of those folks in that will wreck your school district. Do not let them turn Iowa or the U.S. into California.
5-Year Graduation Rates, school years ending 2022 & 2023 = 84.25%. For school years ending 2018 & 2019 = 87.25%. Tell me how they can have graduation rates at that level when their District is doing abysmal on English Language Arts? They did not just miss the mark by a few points, they were dozens of points below the state average & the state average is not exactly anything to write home about.
5-Year Graduation Rates by race, school years ending 2022 & 2023: Blacks = 89.55%, Hispanic = 82.4% & ELLs (other groups underrepresented) = 76.8%. 5-Year Graduation Rates by race, school years ending 2018 & 2019: Blacks = 89.2%, Hispanic = 86.7% & ELLs = 78.75%.
Inglewood City is 39.5% Black, 49.3% Hispanic, the Student Body is 42.8% Black & 45.4% Hispanic.
https://www.nationsreportcard.gov/profiles/stateprofile/overview/CA https://nces.ed.gov/nationsreportcard/subject/publications/stt2022/pdf/2023010CA8.pdf https://nces.ed.gov/nationsreportcard/subject/publications/stt2019/pdf/2020014CA8.pdf NAEP results from CA show us that “students of color” are doing poorly in the Golden State. Must not be enough taxpayer money from Washington.
Reading, Grade 8 in 2022 has 41% of Blacks & Hispanics below basic, 22% of Whites & only 14% of Asians below basic. Reading Grade 8 in 2019, 40% of Hispanics, 57% of Blacks & 17% of Whites & only 13% of Asians are “below basic.”
https://www.caschooldashboard.org/reports/ca/2023/conditions-and-climate#suspension-rate https://www.caschooldashboard.org/reports/ca/2022/conditions-and-climate#suspension-rate Who is suspended in California schools? Black students (8.35% suspended at least one day) lead the way among races (Foster Youth are also suspended at a high rate), Filipino & Asian students are suspended the least. Are you surprised? Those Asian students will get their butts kicked by that guy called DAD when they get home!
https://tdepublicschools.ondemand.sas.com/district/00792/assessment https://nces.ed.gov/Programs/Edge/ACSDashboard/4700148 https://nces.ed.gov/ccd/districtsearch/district_detail.asp?Search=2&ID2=4700148 https://tdepublicschools.ondemand.sas.com/state/assessment https://www.tn.gov/education/districts/federal-programs-and-oversight/data/data-downloads.html (this link will take you to areas where you can download District data on Excel) Memphis, Tennessee: Families with Food Stamp/SNAP benefits (37.6%), Parents (of children in Government school) not in the labor force (16.3%), Children in Government School living w/ a married couple (38.3%) & Children in Government School living in a single parent household (53.9%)
Overall ELA (all grades) Districtwide in Shelby County/Memphis, school years ending 2017 through 2019 – 79.8% of the student body on average was below the “met expectations” threshold.
Overall ELA (all grades) Districtwide in Shelby County/Memphis, schools years ending 2021 through 2023 – 80.73% of the student body on average was below the “met expectations” threshold.
Overall ELA (all grades) STATEWIDE in TN, school years ending 2017 through 2019 – 66.1% of the student body on average was below the “met expectations” threshold.
Overall ELA (all grades) STATEWIDE in TN, school years ending 2021 through 2023 – 65.33% of the student body on average was below the “met expectations” threshold. Not good results overall & after a very modest statewide post-plandemic improvement, Memphis fell further behind.
Overall ELA STATEWIDE by RACE, school years ending 2017 through 2019 for Blacks = 18.26% were “proficient.” (The only categories here are “proficient”, I do not have data on the 4 categories from the previous assessment) Hispanic = 23.06% are “proficient”, Asians = 58.76% are “proficient”, ELLs = 14.3% & White = 40.63%.
Overall ELA STATEWIDE by RACE, school years ending 2021 through 2023: Blacks = 18.86% are “proficient”, Hispanic = 24.16%, Asian = 61.5%, ELLs = 14.15% & White = 42.03%. Those dang Asians are smoking everyone, I wonder why that is? Likely a cultural thing, it has nothing to do w/ systematic racism, it has to do w/ culture. I would also argue Asians on average are probably smarter than just about everyone else.
Memphis/Shelby ELA (% proficient) by RACE, school years ending 2017 through 2019: Blacks = 16.6%, Hispanic = 20.7%, Asian = 58.43%, ELLs = 15.43% & White = 51.53%.
Memphis/Shelby ELA (% proficient) by RACE, school years ending 2021 through 2023: Black = 16.13% are proficient, Hispanic = 20.26%, Asian = 61.53%, ELLs = 12.9% & White = 50.1% were “proficient.”
As per usual, Hispanic/Latino & Black students still tend to lag way behind Asians & Whites, but we did not see the massive post-plandemic drop that we saw in California.
https://tdepublicschools.ondemand.sas.com/district/00792/performance/contentAchievement Success Rate by Performance Level: ELA Grades 9 – 12 in Memphis/Shelby: 75% of all students are not meeting expectations. 78.3% of Black students are not meeting expectations, 74.3% of Hispanics, 38.7% of Whites, 27% of Asians are not meeting expectatioins & ELL data N/A.
https://tdepublicschools.ondemand.sas.com/state/performance/contentAchievement Success Rate by Performance Level: ELA Grades 9 – 12 STATEWIDE: 63.5% of all students are not meeting expectations: 79.1% of Blacks are not meeting expectations, 36.7% of Asians, 74.6% of Hispanics, 56.1% of Whites & 84.9% of ELLs are NOT meeting expectations.
For school years ending (STATEWIDE) 2019 & 2020, 13.05% of the student body was chronically absent & for school years ending 2021 & 2022, 17.9% of the student body was chronically absent. https://tdepublicschools.ondemand.sas.com/state/performance/truancy
For school years ending (Memphis/Shelby) 2019 & 2020, 18.5% of the student body was chronically absent & for school years ending 2021 & 2022, 22.25% of the student body as chronically absent https://tdepublicschools.ondemand.sas.com/district/00792/performance/truancy
I do not have a lot of data on chronic absenteeism by race for multiple years. Most recent statewide data indicates that 28.2% of Blacks were chronically absent, Asians = 7.9%, White = 17.7%, ELLs = 18.4% & Hispanic = 20.2%. Asians lead the way, surprised?
Chronic Absenteeism for Memphis/Shelby schools: Black = 28.5%, Asian = 8.2%, White = 14.6%, ELLs = 16.4% & Hispanic = 18.2%.
https://tdepublicschools.ondemand.sas.com/state/performance/gradRateIndicators Dropout Rate Statewide for school years ending 2018 & 2019 = 7.4% & for school years ending 2020 & 2021 = 6.65%.
https://tdepublicschools.ondemand.sas.com/district/00792/performance/gradRateIndicators Dropout Rate in Memphis/Shelby for school years ending 2018 & 2019 = 15.9% & for school years ending 2020 & 2021 = 15.25%.
Dropout Rate Statewide by RACE (the “tell me more” note says for 2021-22): Asian = 1.9%, White = 4.7%, Hispanic = 11.6%, ELLs = 21.4% & Black = 9.9%.
Dropout Rate Memphis/Shelby by RACE: Asian = 5.1%, White = 19.7%, Hispanic = 21%, ELLs = 29.7% & Black = 12.3%.
https://tdepublicschools.ondemand.sas.com/state/performance/gradRate 4-Year Graduation Rates Statewide for school years ending 2018 & 2019 = 89.4% & for school years ending 2020 & 2021 = 89.15%.
4-Year Graduation Rates statewide by RACE (2020-21 year only): Asians = 95.2%, Black = 82.2%, Hispanic = 83%, White = 92% & ELLs = 71%.
https://tdepublicschools.ondemand.sas.com/district/00792/performance/gradRate 4-Year Graduation Rates Memphis/Shelby for school years ending 2018 & 2019 = 79.25% & for school years ending 2020 & 2021 = 77.7%.
4-Year Graduation Rates Memphis/Shelby by RACE (2020-21 only): Black = 78.9%, Hispanic = 71.5%, White = 73.5%, Asian = 87.9% & ELLs = 60.4%. You can see how Memphis lags behind the statewide average on most metrics & the disparity is usually quite large.
https://nces.ed.gov/Programs/Edge/ACSDashboard/4703180 https://nces.ed.gov/ccd/districtsearch/district_detail.asp?Search=2&ID2=4703180 Nashville, TN/Davidson County: Families with Food Stamp/SNAP benefits (24.7%), Parents (of children in Government school) not in the labor force (16.8%), Children in Government School living w/ a married couple (51.1%) & Children in Government School living in a single parent household (41.9%)
https://tdepublicschools.ondemand.sas.com/district/00190/assessment Overall ELA for all grades, school years ending 2017-2019, 74.36% of all students were NOT meeting expectations. Overall ELA for all grades, school years ending 2021-2023, 74.96% were NOT meeting expectations.
Overall ELA (all the following data is for Nashville/Davidson) for all grades, school years ending 2017-19 (we only have proficient or NOT on this metric) by student group: Asians = 41.03% are “proficient”, Whites = 42.66% are “proficient”, Blacks = 17.4%, Hispanic = 18.2%, & ELLs = 11.46%
Overall ELA for all grades, school years ending 2021-2023, ELLs = 9.7% are “proficient”, Asians = 43.43%, Whites = 45.5%, Blacks = 16.53% & Hispanic = 16.96% are “proficient.”
https://tdepublicschools.ondemand.sas.com/district/00190/performance/contentAchievement
https://tdepublicschools.ondemand.sas.com/district/00190/performance/truancy 15.8% of the entire Student Body Districtwide was “chronically absent”, school years ending 2019 & 2020 – for school years ending 2021 & 2022 it was a staggering 29.3%. A massive increase.
Chronic Absenteeism by Race in Nashville: Blacks = 37.5%, White = 21.4%, Hispanic = 28.8%, Asian = 11.3% & ELLs = 26%.
https://tdepublicschools.ondemand.sas.com/district/00190/performance/gradRateIndicators Dropout Rate (2020-21 year only) Districtwide was 10.3%. For Blacks it was 7.9%, Whites = 7.5%, Hispanic = 17.8%, Asian = 2.7% & ELLs = 24.6%.
https://tdepublicschools.ondemand.sas.com/district/00190/performance/contentAchievement Success Rate by Performance Level Districtwide: ELA Grades 9 – 12: 68.8% of the Student Body is NOT meeting expectations. 78.3% of Blacks are NOT meeting expectations, 48.5% of Asians are NOT meeting expectations, 76.8% of Hispanics, 46.3% of Whites & ELLs = N/A.
https://tdepublicschools.ondemand.sas.com/district/00190/performance/gradRate 4-Year Graduation Rate Districtwide (school years ending 2018 & 2019) was 81.3% & for school years ending 2020 & 2021 = 82.05%.
By Race, 4-Year Graduation Rate for school year 2020-21 only: Blacks it was 82.7%, Whites = 87.2%, Asians = 92%, Hispanic = 73.4% & ELLs = 65.4%.
Nashville/Davidson County is 26.8% Black & 10.8% Hispanic, the Student Body is 26.4% Black & 10% Hispanic.
https://tdepublicschools.ondemand.sas.com/state/performance/discipline https://www.tn.gov/content/dam/tn/education/data/discipline_district_suppressed_formatted_2022-23.xlsx https://www.tn.gov/content/dam/tn/education/data/district-discipline-2021-22-2023-06-05.xlsx Black pupils (9.1 & 9.7% for the two years I looked at) in TN get out-of-school suspensions far more often than any other racial group.
https://nces.ed.gov/Programs/Edge/ACSDashboard/2721240 https://nces.ed.gov/ccd/districtsearch/district_detail.asp?Search=2&ID2=2721240 https://rc.education.mn.gov/ https://rc.education.mn.gov/#mySchool/orgId--30001000000__groupType--district__p--3 Minneapolis, Minnesota: Families with Food Stamp/SNAP benefits (27.6%), Parents (of children in Government school) not in the labor force (13.3%), Children in Government School living w/ a married couple (%) & Children in Government School living in a single parent household (37.2%)
54.2% of Minneapolis’ Student Body is chronically absent, the statewide avg. currently sits at 30.2% of students chronically absent.
Districtwide (all students, school years ending 2019), only 47.9% of students are meeting standards in Reading & in school years ending 2022 & 2023 the avg. was 43.9%. https://rc.education.mn.gov/#assessmentsParticipation/orgId--30001000000__groupType--district__test--allAccount__subject--R__accountabilityFlg--Y__year--trend__grade--all__p--e3
https://rc.education.mn.gov/#assessmentsParticipation/orgId--30001000000__groupType--district__test--allAccount__subject--R__accountabilityFlg--Y__year--trend__grade--all__categories--black_s__p--61 Pertaining to Black pupils, (school year ending 2019) only 24.7% were meeting or exceeding expectations in Reading in Minneapolis. For school years ending 2022 & 2023, only 17.75% were meeting or exceeding expectations.
https://rc.education.mn.gov/#assessmentsParticipation/orgId--30001000000__groupType--district__test--allAccount__subject--R__accountabilityFlg--Y__year--trend__grade--all__categories--hispanic_s__p--e3 Same as above, but for Hispanic Pupils, only 30.3% were meeting or exceeding expectations in school year ending 2019. School years ending 2022 & 2023, it fell to 20.1%.
https://rc.education.mn.gov/#assessmentsParticipation/orgId--999999000000__groupType--state__test--allAccount__subject--R__accountabilityFlg--Y__year--trend__grade--all__categories--black_s__p--61 STATEWIDE, 35.3% of Black Pupils were meeting or exceeding (school year ending 2019) standards in Reading & in school years ending 2022 & 2023, it fell to 31.05%.
https://rc.education.mn.gov/#assessmentsParticipation/orgId--999999000000__groupType--state__test--allAccount__subject--R__accountabilityFlg--Y__year--trend__grade--all__categories--hispanic_s__p--61 STATEWIDE for Hispanics, 39.2% were meeting or exceeding Reading expectations in school year ending 2019. School years ending 2022 & 2023, the avg. was only 31.6%. Again, these COVID plandemic lockdowns were deleterious for most kids, especially “students of color”, which mouth-breathing Democrats like Story County, Iowa Supervisor Latifah Faisal, Joe Biden, Bernie Sanders & rat faced Ilhan Omar pretend to care about.
https://rc.education.mn.gov/#northStarAchievement/orgId--999999000000__groupType--state__year--2023__nscomparisonline--FOC_NONE__p--7 STATEWIDE, 47.6% of all students were meeting expectations in Reading.
If you want to look at all ethnic/racial groups, be my guest – Minnesota compiles their interactive data differently than other Education Departments & I don’t feel like posting numerous URLs.
https://rc.education.mn.gov/#graduation/orgId--30001000000__groupType--district__year--2022__graduationYearRate--4__p--b For school years ending 2019 & 2020, the 4-Year Graduation Rate Districtwide was 74.75% (all students) & for school years ending 2021 & 2022 it was 75.2%.
https://rc.education.mn.gov/#graduation/orgId--30001000000__groupType--district__year--2022__graduationYearRate--4__categories--black__p--b For Blacks Districtwide, 69.5% graduated in 4 years (school years ending 2019 & 2020) & for school years ending 2022 & 2023 the avg. was 70%.
https://rc.education.mn.gov/#graduation/orgId--30001000000__groupType--district__year--2022__graduationYearRate--4__categories--hispanic__p--b For Hispanics Districtwide (Minneapolis), 65.75% (school years ending 2019 & 2020) graduated on time & for school years ending 2021 & 2022 it was 60.4%.
https://rc.education.mn.gov/#graduation/orgId--999999000000__groupType--state__year--2022__graduationYearRate--4__p--f STATEWIDE for all students, the 4-Year Graduation Rate was 83.75% (school years ending 2019 & 2020) & the average for school years 2021 & 2022 = 83.45%.
https://rc.education.mn.gov/#graduation/orgId--999999000000__groupType--state__year--2022__graduationYearRate--4__categories--black__p--b STATEWIDE for school years ending 2019 & 2020, 69.55% of Blacks graduated on time & for school years ending 2021 & 2022 it sat at 71.95%.
https://rc.education.mn.gov/#graduation/orgId--999999000000__groupType--state__year--2022__graduationYearRate--4__categories--hispanic__p--b STATEWIDE, school years ending 2019 & 2020, 70.3% of Hispanics graduated on time & for school years ending 2021 & 2022, it was pegged at 69.4%.
https://rc.education.mn.gov/#graduation/orgId--30001000000__groupType--district__year--2022__graduationYearRate--4__categories--asian__p--b Here’s the STATEWIDE & MINNEAPOLIS 4-Year Graduation Rate data for Asians – why are they doing so much better?
https://rc.education.mn.gov/#graduation/orgId--999999000000__groupType--state__year--2022__graduationYearRate--5__categories--EL__p--f STATEWIDE, only 74.45% of ELLs graduated in FIVE years (school years 2019 & 2020) & in school years 2021 & 2022 it was 73.85%. I’m miffed as to why it’s that high, considering how big a % of them are seriously lagging in Reading comprehension.
https://rc.education.mn.gov/#ACCESS/orgId--999999000000__groupType--state__subjectGroup--composite__year--2023__grade--all__accountabilityFlg--Y__p--211 STATEWIDE, 76.3% of ELLs are contained in Levels 1-3.
https://rc.education.mn.gov/#ACCESS/orgId--30001000000__groupType--district__subjectGroup--composite__year--2023__grade--all__accountabilityFlg--Y__p--211 Districtwide (Minneapolis), 81.2% of ELLs are contained in Levels 1-3.
[NOTE: “A student's composite proficiency level can range from 1 to 6. A student is considered proficient if their composite proficiency level is 4.5 and their proficiency levels for at least three of the four domains are 3.5 or higher.”]
As you can see, Minneapolis is a Democrat enclave w/ a murder rate way beyond the national average & MN average, as well as a government school system that is failing its students. Would you hire a plumber or electrician that mucks up 50% of his projects? No, you would not. So why do we continue to shovel money into a government school system that is failing many students? Not all government schools are created equal, but it is obvious we need some school choice in a lot of areas, Minneapolis is one of them.
We also need to NOT invite in half the third-world as this will inundate a lot of school districts w/ children they cannot possibly educate & care for, but there are certain actors in this country that do not care, they just want to bring the United States down to the level of most of Latin America. Import the 3rd world, become the 3rd world.
Minneapolis City is 18.5% Black & 9.9% Hispanic/Latino, the Student Body is 18.2% Black & 9.8% Hispanic/Latino.
https://nces.ed.gov/ccd/districtsearch/district_detail.asp?Search=2&ID2=2733840 https://nces.ed.gov/Programs/Edge/ACSDashboard/2733840 https://rc.education.mn.gov/#mySchool/orgId--10625000000__groupType--district__p--3 St. Paul, MN: Families with Food Stamp/SNAP benefits (31.5%), Parents (of children in Government school) not in the labor force (19.1%), Children in Government School living w/ a married couple (53.7%) & Children in Government School living in a single parent household (34.1%)
Districtwide (all students), ONLY 36.4% of students were meeting standards in Reading (school years ending 2019 & 2021) & school years ending 2022 & 2023, it was 34.35%. 42.8% of St. Paul students are chronically absent.
Districtwide (all students, school years ending 2019 & 2020), the 4-Year Graduation Rate = 77.3% & school years 2021 & 2022 = 75.7%.
https://rc.education.mn.gov/#graduation/orgId--10625000000__groupType--district__year--2022__graduationYearRate--4__categories--black__p--b Graduation Rates in St. Paul for Blacks, school years 2019 & 2020 = 68.75% & school years 2021 & 2022 = 66.95%.
https://rc.education.mn.gov/#graduation/orgId--10625000000__groupType--district__year--2022__graduationYearRate--4__categories--hispanic__p--b 4-Year Graduation Rates for Hispanics in St. Paul, school years 2019 & 2020 = 67.4% & school years ending 2021 & 2022 = 63.65%.
https://rc.education.mn.gov/#graduation/orgId--10625000000__groupType--district__year--2022__graduationYearRate--5__categories--hispanic%7CEL__p--b Pertaining to ELLs, school years 2019 & 2020, only 65.8% graduated in FIVE years & only 62.45% for school years 2021 & 2022.
https://rc.education.mn.gov/#assessmentsParticipation/orgId--10625000000__groupType--district__test--allAccount__subject--R__accountabilityFlg--Y__year--trend__grade--all__p--61 Pertaining to Reading Achievement in St. Paul, 59.8% of the entire student body was below expectations for school year 2019 & for school years 2022 & 2023 it was 65%.
https://rc.education.mn.gov/#assessmentsParticipation/orgId--10625000000__groupType--district__test--allAccount__subject--R__accountabilityFlg--Y__year--trend__grade--all__categories--black_s__p--61 Reading achievement for Blacks in St. Paul, 74.8% were not meeting expectations in school year 2019, for school years 2022 & 2023 it was 79.75%.
https://rc.education.mn.gov/#assessmentsParticipation/orgId--10625000000__groupType--district__test--allAccount__subject--R__accountabilityFlg--Y__year--trend__grade--all__categories--hispanic_s__p--61 Reading achievement for Hispanics in St. Paul, 68.3% were NOT meeting expectations in school year 2019 – as for school years 2022 & 2023 it was 74.95% NOT meeting expectations.
https://rc.education.mn.gov/#assessmentsParticipation/orgId--10625000000__groupType--district__test--allAccount__subject--R__accountabilityFlg--Y__year--trend__grade--all__categories--EL__p--61 ELLs in St. Paul are typically in the 90% range NOT meeting expectations in Reading, yet Joe Biden wants to dump millions of those all over the nation, including rural Iowa. He wants to wreck your school districts.
https://rc.education.mn.gov/#assessmentsParticipation/orgId--999999000000__groupType--state__test--allAccount__subject--R__accountabilityFlg--Y__year--trend__grade--all__categories--asian_s__p--61 https://rc.education.mn.gov/#assessmentsParticipation/orgId--10625000000__groupType--district__test--allAccount__subject--R__accountabilityFlg--Y__year--trend__grade--all__categories--asian_s__p--61 Compare Asian Reading Achievement STATEWIDE w/ the St. Paul District. The Twin Cities Government School Districts are lagging behind the state of MN & they are doing poorly.
St. Paul City is 15.6% Black & 8.6% Hispanic, the Student Body is 15.8% Black & 8.7% Hispanic/Latino.
https://www.nationsreportcard.gov/profiles/stateprofile/overview/MN https://nces.ed.gov/nationsreportcard/subject/publications/stt2022/pdf/2023010MN8.pdf https://nces.ed.gov/nationsreportcard/subject/publications/stt2019/pdf/2020014MN8.pdf NAEP results for Grade 8, 2019 & 2022 indicate that in the former year, 56% of Blacks & 43% of Hispanics are below basic. In the latter year, 55% of Blacks & 45% of Hispanics are below basic. White pupils are outperforming Asians in MN.
https://rc.doe.state.nj.us/ https://rc.doe.state.nj.us/selectreport/2021-2022/13/3570 https://rc.doe.state.nj.us/2021-2022/district/detail/13/3570/overview https://rc.doe.state.nj.us/2022-2023/district/summary/13/3570/overview https://nces.ed.gov/ccd/districtsearch/district_detail.asp?Search=2&ID2=3411340 https://nces.ed.gov/Programs/Edge/ACSDashboard/3411340 Newark, New Jersey: Families with Food Stamp/SNAP benefits (35.2%), Parents (of children in Government school) not in the labor force (18.6%), Children in Government School living w/ a married couple (39.8%) & Children in Government School living in a single parent household (51.9%)
Newark is a train wreck. For school years ending 2021-2023, 17.83% of the Student Body was “chronically absent” & for school years ending 2020 & 2019 = 16.6% (no data for 2020). Not as bad as the worst Districts I’ve covered. Black pupils are chronically absent far more often than all other groups.
For school years ending 2022 & 2023, only 28.3% of students were meeting (or exceeding) expectations in ELA. Only 29.9% of Hispanics were meeting or exceeding expectations, only 23.9% of Blacks & 17.2% of ELLs.
Democrats DO NOT want school choice, they don’t want the parents to have the money the government already spends to enroll their child in a school where they will learn to read & think critically, they want them trapped in a school that will hypersexualize them & talk to them about “changing” their gender. This is done on purpose.
For school years ending 2018 & 2019, only 35.65% of students met or exceeded expectations in ELA.
For school years ending 2022 & 2023, the 5-Year Graduation Rate = 85.25% & the 4-Year Graduation Rate = 85.4%. Yes, it did come out that way, I checked twice.
For school years ending 2021 & 2020, the 5-Year Graduation Rate = 81.55% & the 4-Year Graduation Rate = 81.05%.
Newark City is 47% Black & 37.2% Hispanic, the Student Body is 46.5% Black & 36.8% Hispanic.
https://nces.ed.gov/Programs/Edge/ACSDashboard/3402640 https://nces.ed.gov/ccd/districtsearch/district_detail.asp?Search=2&ID2=3402640 https://rc.doe.state.nj.us/2021-2022/district/detail/07/0680/overview https://rc.doe.state.nj.us/2022-2023/district/detail/07/0680/overview Camden City, NJ: Families with Food Stamp/SNAP benefits (57.5%), Parents (of children in Government school) not in the labor force (24%), Children in Government School living w/ a married couple (21.5%) & Children in Government School living in a single parent household (69.2%)
Camden City is 53.3% Hispanic & 42.9% Black, the Student Body is 39.3% Black & 52.8% Hispanic.
For school years ending 2021-2023, a whopping 54.8% of its student body was chronically absent. YIKES!
For school years ending 2022 & 2023, only 10.5% of the student body was exceeding or meeting ELA standards. For school years ending 2018 & 2019, the ELA rate was 15.4%. Nice job, we should probably pour more money into that school. Are these kids failing because the parents suck, the school & the teachers are useless or both, because they both can’t be good.
For school years ending 2021 through 2023, the 4-Year Graduation Rate = 63.16% & the 5-Year Graduation Rate = 71.36%.
Is this the diversity the Democrats were talking about & what if they did this to the entire country? They literally want a permanent underclass & this pathetic government school system is producing the voters they want. This is done on purpose.
https://nces.ed.gov/Programs/Edge/ACSDashboard/1300120 https://nces.ed.gov/ccd/districtsearch/district_detail.asp?Search=2&ID2=1300120 https://public.gosa.ga.gov/noauth/extensions/SchoolGrades-Georgia/SchoolGrades-Georgia.html?lang=English&SchoolName=atlanta-public-schools Atlanta, Georgia: Families with Food Stamp/SNAP benefits (37.7%), Parents (of children in Government school) not in the labor force (16.5%), Children in Government School living w/ a married couple (34.4%) & Children in Government School living in a single parent household (59%)
For school year ending 2022, 67.5% of Atlanta pupils are below “proficient” & “distinguished” in English (Elementary). For school year ending 2022, 67.9% of Atlanta pupils are below “proficient” & “distinguished” in English (Middle School). Reading at or above the Grade Level Target (8th Grade), 42.2% are not reading at grade level in school year ending 2019 & 51.97% were not reading at grade level (Eighth Grade) in school years 2022 & 2023. COVID made it worse, imagine that.
4-Year Graduation Rate (school years 2020-2022) = 82.48%. Georgia does NOT make it easy to find chronic absenteeism data Districtwide, so I am not going to collate all the schools in Atlanta & calculate it, that would take a long time.
Atlanta’s performance regularly ranks behind GA Statewide performance.
Atlanta City is 5.4% Hispanic & 47.6% Black, the Student Body is 48% Black & 5% Hispanic.
https://nces.ed.gov/ccd/districtsearch/district_detail.asp?Search=2&ID2=1302280 https://nces.ed.gov/Programs/Edge/ACSDashboard/1302280 https://public.gosa.ga.gov/noauth/extensions/SchoolGrades-Georgia/SchoolGrades-Georgia.html?lang=English&SchoolName=fulton-county Fulton County School District, GA: Families with Food Stamp/SNAP benefits (18.3%), Parents (of children in Government school) not in the labor force (16.1%), Children in Government School living w/ a married couple (64.4%) & Children in Government School living in a single parent household (31.6%)
For school year ending 2022, 48% of Fulton County District’s pupils were below “proficient” or “distinguished” in English (Elementary). For school year ending 2022, 48.2% of Fulton County District’s pupils were below “proficient” or “distinguished” in English (Middle School). Reading at or above the Grade Level Target (8th grade) in school year ending 2019, 28.9% are not reading at grade level & for school years ending 2022 & 2023, 33.21% are not reading at grade level.
4-Year Graduation Rate (school years 2020-2022) = 87.49%.
Fulton County is 7.4% Hispanic & 45% Black, the Student Body is 38.1% Black & 8.9% Hispanic.
https://nces.ed.gov/Programs/Edge/ACSDashboard/1300420 https://nces.ed.gov/ccd/districtsearch/district_detail.asp?Search=2&ID2=1300420 Bibb County (Macon) School District, GA: Families with Food Stamp/SNAP benefits (35.6%), Parents (of children in Government school) not in the labor force (16%), Children in Government School living w/ a married couple (38.7%) & Children in Government School living in a single parent household (54.7%)
For school year ending 2022, 77.1% of Bibb County District’s pupils were below “proficient” or “distinguished” in English (Elementary). For school year ending 2022, 77.5% of students were below “proficient” or “distinguished” in English (Middle School). Reading at or above the Grade Level Target (8th grade) in school year ending 2019, 50.5% are not reading at grade level & for school years ending 2022 & 2023, 60.41% are not reading at grade level.
4-Year Graduation Rate (school years 2020-2022) = 79.25%.
Bibb County is 4.1% Hispanic & 57.1% Black, the Student Body is 54.2% Black & 4% Hispanic.
https://public.gosa.ga.gov/noauth/extensions/SchoolGrades-Georgia/SchoolGrades-Georgia.html?lang=English&SchoolName=dougherty-county https://nces.ed.gov/ccd/districtsearch/district_detail.asp?Search=2&ID2=1301830 https://nces.ed.gov/Programs/Edge/ACSDashboard/1301830 Dougherty County (Albany), GA: Families with Food Stamp/SNAP benefits (48.5%), Parents (of children in Government school) not in the labor force (15.7%), Children in Government School living w/ a married couple (27.9%) & Children in Government School living in a single parent household (62.3%)
For school year ending 2022, 79.7% of Dougherty County District’s pupils were below “proficient” or “distinguished” in English (Elementary). For school year ending 2022, 75.7% of Dougherty County District’s pupils were below “proficient” or “distinguished” in English (Middle School). Reading at or above the Grade Level Target (8th grade) in school year ending 2019, 59.1% are not reading at grade level & for school years ending 2022 & 2023, 65.34% are not reading at grade level.
4-Year Graduation Rate (school years 2020-2022) = 85.55%. Dougherty regularly lags behind GA statewide, so how on earth can their 4-Year Graduation Rates be on par or slightly above GA statewide, when massive percentages of 8th graders are not reading at grade level & they lag behind the state in every single course in High School?
If the goal is to create SJWs who spend more time wondering if they’re homosexual or transgender – they’ll never get a decent job, but it’s another vote for Joe Biden. If that’s the goal then I see what is going on, but if the goal is to create bright students that are skilled & can find a job, keep it & move up the ladder – then we have an issue.
Dougherty County is 3.3% Hispanic & 71.7% Black, the Student Body is 69.5% Black & 3% Hispanic.
https://nces.ed.gov/Programs/Edge/ACSDashboard/1734410 https://nces.ed.gov/ccd/districtsearch/district_detail.asp?Search=2&ID2=1734410 https://www.illinoisreportcard.com/district.aspx?districtid=49081041025 Rock Island City, Illinois: Families with Food Stamp/SNAP benefits (34.3%), Parents (of children in Government school) not in the labor force (16.5%), Children in Government School living w/ a married couple (56.2%) & Children in Government School living in a single parent household (37%)
School years ending 2018 & 2019, 28% of the student body was chronically absent & for school years ending 2021-2023, it was 37.83%.
Black pupils were chronically absent (35.5% in school years ending 2018 & 2019 & 49.3% school years 2021-23) quite often, Hispanic pupils (27.1% in school years 2018 & 2019, 40.16% in school years 2021 through 2023) were in the same boat unfortunately. ELLs = 16.75 (2018 & 2019) & 32.26% (2021 through 2023). Is racism causing that or a tepid home life? Asians did the best on that metric, surprised?
Rock Island’s chronic absentee issue is much worse than IL statewide. That will also not surprise you.
Rock Island City’s Dropout Rate is much higher than the state average, for school years ending 2018 & 2019 = 5.35%. School years ending 2021-23 = 5.7%. Blacks (school years ending 2018, 2019 & 2021-23) = 7.3 & 6.76%, Hispanic = 5.15 & 4.63%. ELLs = 2.85 & 5.05%. This is not nearly as bad as some Districts.
https://www.illinoisreportcard.com/district.aspx?source=trends&source2=iar&Districtid=49081041025 For school years 2021 through 2023, <15% of the District’s Pupils were meeting or exceeding expectations in ELA. Only 6.43% of Black students met or exceeded expectations, only 9.8% of Hispanics, only 16.9% of ELLs, 24.3% of Whites & 17.86% of Asians. This District is severely underperforming.
School years ending 2021 through 2023, the 5-year Graduation Rate = 80.23%. That’s disheartening when about one-fifth of kids fail to graduate in 5 years. They’re way behind, that’s why.
79.7% of Blacks graduated in 5 years (2021 through 2023), 84.86% of ELLs & 80.26% of Hispanics.
Rock Island City is 13.6% Hispanic & 17.1% Black, the Student Body is 15% Black & 12.6% Hispanic.
https://www.education.pa.gov/K-12/ESSA/ESSAReportCard/DataSources/Pages/default.aspx https://public.tableau.com/app/profile/padeptofed/viz/shared/SZWZ22PTQ https://nces.ed.gov/ccd/districtsearch/district_detail.asp?Search=2&ID2=4218990 https://www.education.pa.gov/K-12/ESSA/ESSAReportCard/Pages/default.aspx https://nces.ed.gov/Programs/Edge/ACSDashboard/4218990 https://www.education.pa.gov/DataAndReporting/CohortGradRate/Pages/default.aspx https://public.tableau.com/app/profile/padeptofed/viz/shared/8T8CH82HQ https://public.tableau.com/app/profile/padeptofed/viz/shared/XNPTQGQ94 Philadelphia County, Pennsylvania: Families with Food Stamp/SNAP benefits (47.3%), Parents (of children in Government school) not in the labor force (20.9%), Children in Government School living w/ a married couple (38.3%) & Children in Government School living in a single parent household (53%)
School years ending 2022 & 2023, 25.69% (on average) of all students were “below basic” (ELA) & 61.93% of students are not proficient (basic or below). 29.45% of Black students are “below basic”, as well as 32.94% of Hispanics, 10.5% of Asians, 33.39% of ELLs, 49.91% of Migrants (only 4.68% of “Migrants” are proficient or better in ELA) & 14.19% of Whites are “below basic.” Keep in mind, those migrants are the folks Joe Biden & Story County, Iowa Supervisor & Resident Hobbit Latifah Faisal want to dump all over the state of Iowa. Remember that in November kids.
Compare the ELA averages in Philly (and a few more PA cities I will cover) w/ state averages, see how poorly they perform for all students & also minorities. This is done on purpose. https://public.tableau.com/app/profile/padeptofed/viz/shared/6XFHS4DHP https://public.tableau.com/app/profile/padeptofed/viz/shared/C8N3DPYCK
Only 74.05% of Philly students graduate in 5 years (school years ending 2021-2023), much lower than the state average. Surprised?
https://www.axios.com/local/philadelphia/2022/10/25/philadelphia-school-district-truancy https://www.inquirer.com/education/inq2/chronic-student-absenteeism-growing-problem-education-philly-20230531.html Almost 50% of Philly’s students are “chronically absent” & that issue was exacerbated by the COVID-19 plandemic lockdowns. From March 2020 to the beginning of the 2021-22 school year, Philly students were “learning” remotely.
Golly gee why are Philly’s “students of color” having so much difficulty getting in the door (by admission of the very “people of color” who run the schools in this uber-Democrat city), but it’s not a huge problem w/ Asians? Maybe it’s a cultural thing, eh? Maybe Philly’s “students of color” lack a father at home? Creepy old man Sam Seder probably attributes it to white supremacy or some other convenient, imaginary boogeyman – I just call it bad family planning & bad parenting. You know a bit about that, don’t you Sam?
Philly’s Student Body is 39.6% Black & 15% Hispanic, the County is 43% Black & 16.1% Hispanic. There’s your diversity in a city run by Democrats.
https://nces.ed.gov/Programs/Edge/ACSDashboard/4219170 https://nces.ed.gov/ccd/districtsearch/district_detail.asp?Search=2&ID2=4219170 https://public.tableau.com/app/profile/padeptofed/viz/shared/HHSTCHCFW https://public.tableau.com/app/profile/padeptofed/viz/shared/52KGJ3ZDG Pittsburgh, PA: Families with Food Stamp/SNAP benefits (38.6%), Parents (of children in Government school) not in the labor force (16.9%), Children in Government School living w/ a married couple (41.2%) & Children in Government School living in a single parent household (51.4%)
School years ending 2022 & 2023, 19% of all students were “below basic” in ELA & 57.35% of all students were not proficient (below basic or basic). 25.7% of Blacks were “below basic”, as well as 20.33% of Hispanics, 30% of ELLs, 12.87% of Asians & 8.84% of Whites.
87.12% of Pittsburgh’s Student Body graduates in Five Years. Pittsburgh’s Student Body is 22.9% Black & 3.6% Hispanic, the city is 3.6% Hispanic & 23.2% Black.
https://nces.ed.gov/Programs/Edge/ACSDashboard/4211580 https://nces.ed.gov/ccd/districtsearch/district_detail.asp?Search=2&ID2=4211580 https://public.tableau.com/app/profile/padeptofed/viz/shared/TN9GGRHQ5 https://public.tableau.com/app/profile/padeptofed/viz/shared/KBSHDCGN5 Harrisburg, PA: Families with Food Stamp/SNAP benefits (53.8%), Parents (of children in Government school) not in the labor force (22.5%), Children in Government School living w/ a married couple (28.1%) & Children in Government School living in a single parent household (62.5%)
School years ending 2022 & 2023, 39.34% of all students are “below basic” in ELA, 79.72% of all students are not proficient (basic or below basic) or better. 39.25% of Blacks are “below basic”, as well as 40.25% of Hispanics, 21.47% of Asians, 34.56% of Whites & 46.37% of ELLs.
78.33% of Harrisburg’s Student Body graduates in 5 years (school years ending 2021 through 2023). Harrisburg’s Student Body is 44% Black & 25.1% Hispanic, the city is 24.7% Hispanic & 46.4% Black.
https://nces.ed.gov/Programs/Edge/ACSDashboard/4823640 https://nces.ed.gov/ccd/districtsearch/district_detail.asp?Search=2&ID2=4823640 https://tea.texas.gov/texas-schools/accountability/academic-accountability/performance-reporting/school-report-cards https://rptsvr1.tea.texas.gov/perfreport/frc/frc_srch.html?year=2023 Houston, Texas: Families with Food Stamp/SNAP benefits (30%), Parents (of children in Government school) not in the labor force (22.7%), Children in Government School living w/ a married couple (53.6%) & Children in Government School living in a single parent household (37.2%)
School years ending 2021-23, 64.33% of all students in Houston were reading at grade level (all grades) or above. For that same time frame, 60% of Blacks were reading at or above grade level, 61.3% of Hispanics, 48.66% of ELLs, 87.33% of Whites, 83% of Asians & 52.66% of Migrants.
School years ending 2021 through 2023, the 4-Year Graduation Rate = 82.9% for all students. For the same time, 82.53% of Blacks graduated in 4 years, 81.76% of Hispanics, 86.6% of Whites, 92.63% of Asians & 68.63% of ELLs.
For school years ending 2020 through 2022, 19.16% of all students had “chronic absenteeism.” That same time frame, 27.26% of Blacks, 19% of Hispanics, 7.66% of Whites, 17.9% of ELLs & 5.73% of Asians. Houston is not nearly as bad as many other Districts that are an unmitigated disaster.
Houston City is 44.8% Hispanic & 22.4% Black, the Student Body is 23.3% Black & 43.7% Hispanic.
https://rptsvr1.tea.texas.gov/cgi/sas/broker?_service=marykay&_program=adhoc.download_static_DAG_summary.sas&district=&agg_level=STATE&referrer=Download_State_DAG_Summaries.html&test_flag=&_debug=0&school_yr=23&report=01&report_type=html&Download_State_Summary=Next https://rptsvr1.tea.texas.gov/cgi/sas/broker?_service=marykay&_program=adhoc.download_static_DAG_summary.sas&district=&agg_level=STATE&referrer=Download_State_DAG_Summaries.html&test_flag=&_debug=0&school_yr=22&report=01&report_type=html&Download_State_Summary=Next In the two school years I looked at, 9.36% of Black Students (4.26% of all students) received out-of-school suspensions. Only 0.85% of Asians received out-of-school suspensions in TX. Why is that?
https://nces.ed.gov/Programs/Edge/ACSDashboard/3200060 https://nces.ed.gov/ccd/districtsearch/district_detail.asp?Search=2&ID2=3200060 http://nevadareportcard.nv.gov/di/ http://nevadareportcard.nv.gov/DI/nv/clark/2023 Clark County, Nevada: Families with Food Stamp/SNAP benefits (21.1%), Parents (of children in Government school) not in the labor force (19%), Children in Government School living w/ a married couple (58%) & Children in Government School living in a single parent household (32.4%)
School years 2021-23, only 45.3% of High School pupils were proficient or better in ELA. You can drill down to all sorts of nifty stats (I am NOT going to post all the links, find some of this yourself) http://nevadareportcard.nv.gov/di/report/summary_1?report=summary_1&scope=e25.y18.y19.y20&organization=c2484&scores=N_ELA%2CELA_NotTested%2CELA_Tested%2CELA_Pass%2CELA_level&filterdata=ethnicity_B%2Cethnicity_H&filterkey=ethnicity.B%2Cethnicity.H&filterrelation=and&num=20&page=1&pagesize=20&domain=assessment& on the site & Black & Hispanic students combined (Grade 11), 66.83% were NOT meeting or exceeding ELA standards for school years 2021-2023. <5% of ELLs are meeting or exceeding ELA standards. Gee, what will happen to your District if thousands of migrants are dumped in it?
If you do not comprehend the English language well, you will likely struggle w/ Math, Science & everything else. ELA is very important & in Clark County, “Students of Color” are struggling. Whose fault? The parents and/or the Government School District?
For school years ending 2021-2023, the 4-Year Graduation Rate = 81.8%. For school years ending 2021-2023, the 5-Year Graduation Rate = 82.8%. Black & Hispanic students combined had a 4-Year Graduation Rate (same time frames) = 78.23% & their 5-Year Graduation Rate = 79.4%. How come ELLs graduated (4 years) at a rate of 71.73% when >95% of them are not meeting ELA expectations? https://archive.ph/58nQc
For school years ending 2021-23, 37.73% of all students were “chronically absent” & in those same years, 50.2% of Blacks were chronically absent, as were 39.83% of Hispanics & 39.4% of ELLs. Why are Asians chronically absent so much less than all other groups and why do I ask that question over & over again?
Creepy old man Sam Seder does not want school choice because once these kids are able to shed the victimhood, “you’ll never make it mentality”, many will leave the Democrat Party.
The impetus for this evaluation was my own work on murder stats & this piece by Victor Joecks. https://www.reviewjournal.com/opinion/opinion-columns/victor-joecks/victor-joecks-only-110-black-male-ccsd-8th-graders-proficient-in-math-2662621/ Progressives often give “students of color” lip service, yet this District (along w/ numerous ones I’ve already covered & will cover) has a poor performance rate for “students of color.”
https://www.nationsreportcard.gov/profiles/stateprofile/overview/NV https://nces.ed.gov/nationsreportcard/subject/publications/stt2022/pdf/2023010NV8.pdf https://nces.ed.gov/nationsreportcard/subject/publications/stt2019/pdf/2020014NV8.pdf Reading Grade 8 in 2019, 44% of Blacks & 39% of Hispanics were below basic. Reading Grade 8 in 2022, 46% of Blacks & 39% of Hispanics are below basic.
Clark County is 32.6% Hispanic & 13.8% Black, the Student Body is 32% Hispanic & 11.5% Black.
https://nces.ed.gov/Programs/Edge/ACSDashboard/1804770 https://nces.ed.gov/ccd/districtsearch/district_detail.asp?Search=2&ID2=1804770 https://www.in.gov/doe/it/data-center-and-reports/ https://www.in.gov/doe/it/data-center-and-reports/data-reports-archive/ Indianapolis, Indiana: Families with Food Stamp/SNAP benefits (37.3%), Parents (of children in Government school) not in the labor force (20.1%), Children in Government School living w/ a married couple (40.9%) & Children in Government School living in a single parent household (49.5%)
https://www.in.gov/doe/files/2023-iread3-final-statewide-student-performance.xlsx https://www.in.gov/doe/files/iread3-final-corporation-and-school-results-2023.xlsx https://www.in.gov/doe/files/2022-iread3-final-statewide-student-performance.xlsx https://www.in.gov/doe/files/2022-iread3-final-corporation-and-school-results.xlsx Pertaining to IREAD-3 Assessment Results (school years ending 2022 & 2023), 61.7% of all Indianapolis pupils were adjudged “proficient.” The state average for that period was (public schools) 80.85%. Indy is lagging behind the state. The average for pupils in “non-public” schools was 92.35%.
Statewide, Whites (87.75%, same time frame as above) led the way followed by Asians (84.95%), Blacks (64.85%) & Hispanics (69.25%) lagged way behind. Why do government schools fail to educate “students of color” so often? Is this done on purpose? If not, why are Democrats & child groomers at the ACLU so ardent at stopping school choice programs?
https://www.in.gov/doe/files/iread3-final-disaggregated-report-2023.xlsx https://www.in.gov/doe/files/2022-iread3-final-disaggregated-report.xlsx https://www.in.gov/doe/files/2021-iread3-final-disaggregated-report.xlsx For school years ending 2021 through 2023 in Indianapolis, only 52.86% of Black pupils were “proficient” & 51.8% of Hispanics.
https://www.in.gov/doe/files/DOE-Chronic-Absenteeism-SY2021.xlsx https://www.in.gov/doe/files/DOE-Chronic-Absenteeism-SY2023.xlsx For school year ending 2021, 42.3% of Indy students were “chronically absent”, the state rate was 18.5%. School year ending 2023, the statewide avg. was 19.2% & in Indy it was 35.4%.
https://www.wbaa.org/education/2021-10-28/chronic-absenteeism-spiked-during-covid-in-indiana-schools https://www.chalkbeat.org/indiana/2023/12/19/indiana-chronic-absenteeism-lawmakers-seek-enforcement-family-engagement/ I’ve beaten this horse many times in this essay, but after the COVID plandemic lockdowns chronic absenteeism spiked & Indiana was no different. “Students of color” were already experiencing issues in that area & it got much worse. Democrats do not care.
For school years ending 2022 & 2023, 80.7% of all Indy pupils graduated in 4 years. For school years 2021 & 2020 = 75.44%. Blacks (school years ending 2022 & 2023) = 78.79% & Hispanic = 85.54%. For school years ending 2020 & 2021, Blacks = 74.44% & Hispanic = 76.7%.
Statewide, Asians are leading the way in Graduation Rates, followed by Whites, then Hispanics & Black students. Indiana does not have a lot of ELLs. Indianapolis City is 10.9% Hispanic & 28.8% Black, the Student Body is 35% Black & 13.6% Hispanic.
https://nces.ed.gov/Programs/Edge/ACSDashboard/1810290 https://nces.ed.gov/ccd/districtsearch/district_detail.asp?Search=2&ID2=1810290 South Bend, Indiana: Families with Food Stamp/SNAP benefits (26%), Parents (of children in Government school) not in the labor force (15.2%), Children in Government School living w/ a married couple (51.1%) & Children in Government School living in a single parent household (36.5%)
Pertaining to IREAD-3 Assessment Results (school years ending 2022 & 2023), 58.05% of South Bend’s Student Body was categorized a “proficient.” For school years ending 2021 through 2023 in South Bend, only 45.16% of Black pupils were “proficient” & 52.63% of Hispanics.
School Year ending 2021, 48.5% of South Bend’s Student Body was “chronically absent” & for 2023 = 39.4%.
For school years ending 2022 & 2023, 80% of South Bend’s Student Body graduated in 4 years, for school years 2020 & 2021 = 74.72%. For Black students (2022 & 2023) = 76.42%, Hispanic = 79.1%. School years 2020 & 2021, Black = 68.89% & Hispanic = 74.69%.
South Bend’s Student Body is 17.8% Black & 12.2% Hispanic, the city is 16.4% Hispanic & 25.4% Black.
https://nces.ed.gov/ccd/districtsearch/district_detail.asp?Search=2&ID2=1803870 https://nces.ed.gov/Programs/Edge/ACSDashboard/1803870 Gary, Indiana: Families with Food Stamp/SNAP benefits (57.2%), Parents (of children in Government school) not in the labor force (25.3%), Children in Government School living w/ a married couple (18.6%) & Children in Government School living in a single parent household (68.6%)
Pertaining to IREAD-3 Assessment Results (school years ending 2022 & 2023), only 44.8% of Gary’s Student Body was “proficient.” For school years ending 2021 through 2023 in Gary, only 41.56% of Black pupils in Gary were proficient, only 42.96% of Hispanic kids were proficient. Not good results.
School year ending 2021, 61.2% of Gary’s Student Body was “chronically absent” & school year 2023 = 66%. I would wager this has been a problem in Gary for decades, #whitesupremacy is the culprit of course.
For school years ending 2022 & 2023, 69.77% of Gary pupils graduated in 4 years, years 2020 & 2021 = 61.71%. For Black students (2022, 2023) it was 70.07%, Hispanic = 63.64%.
Gary City is 9.4% Hispanic & 77.6% Black, The Student Body is 82.7% Black & 7.8% Hispanic.
https://nces.ed.gov/Programs/Edge/ACSDashboard/2007950 https://nces.ed.gov/ccd/districtsearch/district_detail.asp?Search=2&ID2=2007950 https://ksreportcard.ksde.org/home.aspx?org_no=D0500&rptType=2 Kansas City, Kansas: Families with Food Stamp/SNAP benefits (21.3%), Parents (of children in Government school) not in the labor force (22.8%), Children in Government School living w/ a married couple (56.9%) & Children in Government School living in a single parent household (34.3%)
https://ksreportcard.ksde.org/chronic_absent.aspx?org_no=D0500&rptType=2 Kansas City’s Student Body had a whopping chronic absentee rate of 43.72% (school years 2022 & 2023), the state rate was 23.61%.
Districtwide (2022 & 2023), 23% of Asians were “chronically absent,” Whites = 46.32%, Blacks = 49.1%, Hispanic = 42.86% & ELLs = 39.75%. I think there are a lot of KC students w/ a crummy home life, even more than 1 in 5 Asians miss way too much school & they are way ahead of other groups. Must be racism, eh?
https://ksreportcard.ksde.org/kelpa.aspx?org_no=D0500&rptType=2 KELPA (Kansas English Language Proficiency Assessment) assessments tell us only (school years 2022 & 2023) 7.26% of students district wide were “proficient.” The statewide average was 10%. Districtwide, 15.95% were in the bottom category, “not proficient” & statewide it was 12%.
https://ksreportcard.ksde.org/assessment_results.aspx?org_no=D0500&rptType=2 https://ksreportcard.ksde.org/2018_2023_Assessment_Full_File.xlsx (Select “ELA” on the top right & then “5 years”) For school years ending 2018, 2019 & 2021-2023, 54.8% of KC pupils were in Level 1, the statewide avg. was 31.14%. The COVID plandemic lockdowns made it worse.
Same as above, but in KC, 84.7% of pupils were in Levels One (54.8% in Level One) & Two which is the equivalent of “basic” & “below basic.” Statewide, the average = 65.13% (31.14% statewide are in Level One). Half the students in KC can barely read.
Same as above, but for Hispanics in KC, 74.5% were in Levels One & Two (54.07% in Level 1), Blacks = 88.86% (62.68% in Level One). Asians are performing poorly in KC, much worse than the statewide average & in KC >70% of ELLs are stuck in Level One. No wonder the Democrats want to dump millions of them all over rural Districts, so they can wreck your schools too.
All groups do worse in KC than statewide – surprised? https://ksreportcard.ksde.org/archive.aspx?org_no=D0500&rptType=2 Go through the archives, you’ll find KC has had a horrible government school system for a long time. This is why the creepy old man Sam Seder doesn’t want non-government schools or options. He wants people talking to your 6-year-olds about “changing” their gender, he wants 8-year-olds exposed to homosexuality & they want to talk to your kids about sex, to hypersexualize them & normalize it. They get off on talking to preteen children about sex & have a hissy fit when parents remove books that talk about incest. He wants to damage them & make them dysfunctional, so they’re easy prey for people like horse teeth bartender #AOC to turn them into perpetual victims.
Better stay away from my daughter Sam. You don’t see me walking up to your bastard children & talking to them about how homosexual men are spreading HIV like a bong at a frat party, do you?
https://ksreportcard.ksde.org/grad.aspx?org_no=D0500&rptType=2 https://ksreportcard.ksde.org/2020_2021_Graduation_Full.xlsx For school years ending 2022 & 2023, 71.1% of KC students graduated in 4 years (statewide = 88.7%) & for school years ending 2020 & 2021, 69.65% of KC students graduated on time (statewide = 88.2%).
87.8% of Asians graduated on time (2022 & 2023), 71.15% of Hispanics, Blacks = 73.4%, Whites = 57.1% & ELLs = 75%.
Kansas City, Kansas is 31.6% Hispanic & 21.9% Black, the Student Body is 24.3% Black & 35% Hispanic.
https://msrc.mdek12.org/ https://nces.ed.gov/ccd/districtsearch/district_detail.asp?Search=2&ID2=2802190 https://nces.ed.gov/Programs/Edge/ACSDashboard/2802190 https://msrc.mdek12.org/entity?EntityID=2520-000&SchoolYear=2022 Jackson, Mississippi: Families with Food Stamp/SNAP benefits (43.1%), Parents (of children in Government school) not in the labor force (13.7%), Children in Government School living w/ a married couple (29.3%) & Children in Government School living in a single parent household (61.8%)
https://msrc.mdek12.org/details?EntityID=2520-000&Component=EP&SchoolYear=2022 School years ending 2022 & 2023, only 30.5% of Jackson pupils (Statewide = 44.25%) were “proficient” in English & school years ending 2021 & 2019 it was only 22.7% (statewide = 38.4%). This is disheartening to say the least.
For school years 2022 & 2023, only 29.9% of Blacks were “proficient” in English & school years 2021 & 2019 = 22.15%. On most metrics, Jackson lags behind MS en masse.
https://msrc.mdek12.org/performance?EntityID=2520-000&Component=EPERF&SchoolYear=2022 English Performance Overview (this drills it down a bit better), school years 2022 & 2023, 40.45% of Jackson pupils were below “passing” (Level 3). Statewide = 26.4%. School years 2021 & 2019, 41.25% of Jackson pupils were below “passing” & statewide = 30.15%. School years ending 2022 & 2023, 40.7% of Blacks in Jackson Schools were below “passing.”
https://msrc.mdek12.org/details?EntityID=2520-000&Component=CHRABS&SchoolYear=2022 School years ending 2022 & 2023, 30.25% of Jackson students (statewide = 25.95%) were “chronically absent” & school years 2021 & 2019, 32.85% of Jackson students were chronically absent (statewide = 16.9%). 30.4% of Black Students in Jackson were chronically absent in school years 2022 & 2023.
4-Year Graduation Rates in Jackson (2022 & 2023) = 84.35% & statewide = 88.65%. 4-Year Graduation Rates in Jackson (2021 & 2019) = 76.5% & statewide = 85.85%. School years 2022 & 2023, 84.85% of Blacks in Jackson graduated on time.
*For most metrics they had NO 2020 data because COVID plandemic. Graduation Rates had 2020 data, but I’m covering the same school years so we can have an apples-to-apples comparison* Jackson City is 82.2% Black, the Student Body is 82.4% Black.
https://schoolquality.virginia.gov/ https://nces.ed.gov/ccd/districtsearch/district_detail.asp?Search=2&ID2=5103240 https://nces.ed.gov/Programs/Edge/ACSDashboard/5103240 https://schoolquality.virginia.gov/divisions/richmond-city-public-schools#desktopTabs-2 Richmond, Virginia: Families with Food Stamp/SNAP benefits (38.5%), Parents (of children in Government school) not in the labor force (14.5%), Children in Government School living w/ a married couple (32.1%) & Children in Government School living in a single parent household (58.7%)
English Reading Performance for all pupils (school years ending 2021-2023), 47% were adjudged “proficient” (statewide = 71.66%). Same time frame, only 41% of Black pupils in Richmond were proficient, Hispanic = 38.33%, Asians = 74%, White = 83.33% & ELLs = 23.66%. All of those categories (save White), Richmond performs poorer than the statewide average.
English Writing Performance (school years ending 2022 & 2023), all Richmond students, only 37.5% were “proficient” (or “passed”), statewide = 65%. Districtwide, only 33% of Black students passed (“proficient or better”), Hispanic = 29%, Asians = 57% (only 2022 data), Whites = 84.5% & ELLs = 14%. Again, only for Whites did Richmond do better than the statewide average.
2021 Statewide NAEP Grade 4 Reading, 57% of Blacks are “below basic”, 60% of Hispanics, 23% of Asians, 30% of Whites & 73% of ELLs are below basic. Is systemic racism causing that or poor government schools and/or a tepid home life? https://thehill.com/opinion/education/579750-many-of-americas-black-youths-cannot-read-or-do-math-and-that-imperils-us/
https://schoolquality.virginia.gov/divisions/richmond-city-public-schools#desktopTabs-6 School years ending 2021-23, 22.83% of all Richmond students were “chronically absent” (25.3% in 2023). In School Year ending 2023, 30.1% of Blacks in Richmond were “chronically absent”, Hispanic = 21.6%, Whites = 9.3%, Asian = 16.4% & ELLs = 20.7%.
“Students of color” (Blacks & Hispanics) tend to be the vast majority of long-term suspensions as well in the diverse, Democrat enclave of Richmond (to the tune of >94%). Is that racism or a lack of fathers in the home, which end up sending dysfunctional boys to Government Schools.
https://schoolquality.virginia.gov/divisions/richmond-city-public-schools#desktopTabs-4 75.03% of all Richmond students graduated on time (school years 2021-23), 80.96% of Blacks, Hispanic = 49.7%, Asian = 83.7%, White = 92.06% & ELLs = 43.73%.
Richmond City is 7.6% Hispanic & 44% Black, the Student Body is 45% Black & 7% Hispanic.
https://nces.ed.gov/ccd/districtsearch/district_detail.asp?Search=2&ID2=5102910 https://nces.ed.gov/Programs/Edge/ACSDashboard/5102910 https://schoolquality.virginia.gov/divisions/petersburg-city-public-schools#desktopTabs-2 Petersburg, VA: Families with Food Stamp/SNAP benefits (42.9%), Parents (of children in Government school) not in the labor force (13.9%), Children in Government School living w/ a married couple (29.8%) & Children in Government School living in a single parent household (59.7%)
English Reading Performance for all pupils in Petersburg (school years ending 2021-2023), 45% were “proficient” or better (or “passed”). Same time frame, only 44.66% of Black pupils in Petersburg were proficient, Hispanic = 42.66%, White = 51% & ELLs = 20%.
English Writing Performance (school years ending 2022 & 2023), all Petersburg students, only 31.5% were “proficient” (or “passed”). Districtwide, only 30% of Black students passed (“proficient or better”), Hispanic = 27%, Whites = 45% & ELLs = 6% (2022 only).
https://schoolquality.virginia.gov/divisions/petersburg-city-public-schools#desktopTabs-6 School years ending 2021-23, 38.2% of Petersburg’s Student Body was “chronically absent” (43.1% in 2022-23). In School Year ending 2023, 44.4% of Blacks were chronically absent, Hispanic = 34.6%, Asian = 22.7%, Whites = 37.5% & ELLs = 31.2%.
Same case as Richmond – in Petersburg, Black students are >90% of all long-term suspensions.
https://schoolquality.virginia.gov/divisions/petersburg-city-public-schools#desktopTabs-4 87% of all students graduated on time, (school years ending 2021-23), 89.03% of Blacks, Hispanic = 72%, Asian = 100% (2 years) & ELLs = 59.15%.
Petersburg City is 5.3% Hispanic & 77.3% Black, the Student Body is 75.8% Black & 5% Hispanic.
https://nces.ed.gov/Programs/Edge/ACSDashboard/5103000 https://nces.ed.gov/ccd/districtsearch/district_detail.asp?Search=2&ID2=5103000 https://schoolquality.virginia.gov/divisions/portsmouth-city-public-schools#desktopTabs-2 https://schoolquality.virginia.gov/divisions/portsmouth-city-public-schools#desktopTabs-6 Portsmouth, VA: Families with Food Stamp/SNAP benefits (31.9%), Parents (of children in Government school) not in the labor force (17.8%), Children in Government School living w/ a married couple (43.4%) & Children in Government School living in a single parent household (46.2%)
English Reading Performance for all pupils in Portsmouth (school years ending 2021-2023), 59.33% of all pupils were “proficient” or better. Same time frame, only 55% of Black pupils were proficient or better, Hispanic = 61.33%, White = 73%, Asian = 67.33% & ELLs = 21.33%.
English Writing Performance (school years ending 2022 & 2023), 46.5% of Portsmouth’s Student Body was “proficient” or better. Districtwide, 42.5% of Black pupils were “proficient” or better, Hispanic = 53%, Asian = 62.5% & Whites = 61%.
School years ending 2021-23, 29.76% of Portsmouth’s Student Body was “chronically absent,” (30.5% in 2023). In school year ending 2023, 31.1% of Blacks were chronically absent, Hispanic = 29.6%, Asian = 16.4%, White = 28.7% & ELLs = 35.9%.
https://schoolquality.virginia.gov/divisions/portsmouth-city-public-schools#desktopTabs-4 84.16% (school years ending 2021-23) of Portsmouth City students graduated on time. Same time frame, 84.6% of Blacks, Hispanic = 86.6%, White = 81.23% & ELLs = 76.65% (2 years).
~80% of ELLs are failing Reading, yet almost 80% graduate – go figure.
Blacks are >80% of all long-term suspensions in Portsmouth. Portsmouth City is 5% Hispanic & 51.4% Black, the S
-
 2:32:03
BlackDiamondGunsandGear
13 hours agoAFTER HOURS ARMORY w/ DLD & John from GOA & FLR
26.6K3 -
 1:05:28
Man in America
14 hours agoTREASON? Obama, Hillary, and Soros in the New World Order Agenda EXPOSED w/ Mel K
86.8K80 -
 2:22:46
The Connect: With Johnny Mitchell
14 hours ago $6.07 earnedOne Man's Mission To Stop Human Trafficking: How A Billionaire Mercenary Saved Hundreds Of Children
23.8K18 -
 2:35:13
Tundra Tactical
10 hours ago $12.41 earned🔫 California Ammo Win, Sig Sauer P320 Controversy, Meme Review & Would You Rather! 🎉🔥
40.3K6 -
 16:24
16:24
Forrest Galante
7 hours ago6 Deadliest Man Eaters to Ever Exist
28.1K6 -
 10:14
10:14
MattMorseTV
12 hours ago $15.76 earnedThe EU is in HOT WATER.
96K59 -
 6:51:32
The Rabble Wrangler
1 day agoPUBG with The Best in the West!
25K -
 3:57:19
EvilT4000
10 hours ago $8.34 earnedSaturday.....🟢For energy and focus click my Dubby link!
36.1K3 -
 3:02:55
SlingerGames
7 hours agoSpartan Night - Halo and More | Creator for @SELFMADEGGS
23.7K -
 3:57:49
Mally_Mouse
12 hours agoSpicy Saturday!! - 10k CELEBRATION! - Let's Play: Labyrinthine
36.8K1