Creepy old man Sam Seder hates charter schools Part I
Why creepy old divorcee Sam Seder hates charter schools
When I did an analysis of numerous Democrat-leaning jurisdictions & their sky-high murder rates, I also included a lot of data on their crumbling, ineffective & corrupt government school districts – just the way the Democrats want it. https://web.archive.org/web/20220608034411/https://professor_enigma.webs.com/sam-seder-ilhan-omar-racism3 https://rumble.com/v4d9s0f-creepy-old-man-sam-seder-is-worried-about-guns-his-voters-are-the-problem-p.html (I linked to this entire series in that vid) https://www.facebook.com/permalink.php?story_fbid=2568312326738501&id=1400591836843895 https://www.facebook.com/permalink.php?story_fbid=2568556286714105&id=1400591836843895
Democrats oppose school choice because they need to brainwash your children, they want to talk to your children about sexual acts & they want to convince them that they should or can get their genitals mutilated & “transform” into the opposite gender, which is complete B.S. https://rumble.com/v3w8icm-creepy-mark-d.-langdon-and-biopolaroid-sam-seder-flunked-science.html
Democrats want to control education so they can damage your kids, leaving parents in control lessens the chance they’ll turn your kids into little homosexuals who want to dress in drag. They do not want parents removing their kids from school districts like Ames, Iowa – where Black Lives Matter indoctrination rules the classroom.
They do not want your kids in charter schools, private schools or anything aside from a government school because they need that time w/ your kids to inundate them w/ sexual innuendo, let male pedophiles dressed as women read to your kids (odd why grown men who wear dresses seek a primary audience w/ preteens, isn’t it?) & tell them they’re a victim.
They want universal prekindergarten to get your kids in their brainwashing factories as long as possible so they can undo what mom & dad (unless you’re Sam Seder & your wife left you, you don’t get much time w/ the rugrats anymore) do when little Susie & Tommy get home.
Democrats & Black Lives Matter hate the nuclear family, https://rumble.com/v2s3ci2-blacklivesmatter-sam-seder-and-the-rock-have-something-in-common.html which is why they’ve pushed welfare state policies that allow women to marry the government & reward them for reproduction outside of marriage. This is why they constantly pepper children w/ speeches on homosexuality because they hate traditional marriage. They hate science too, because they apparently believe XY Tommy can “transform” into XX Tammy. https://rumble.com/v3u6uai-creepy-sam-seder-and-mark-d.-langdon-find-out-biology-is-real-science.html Uh, no.
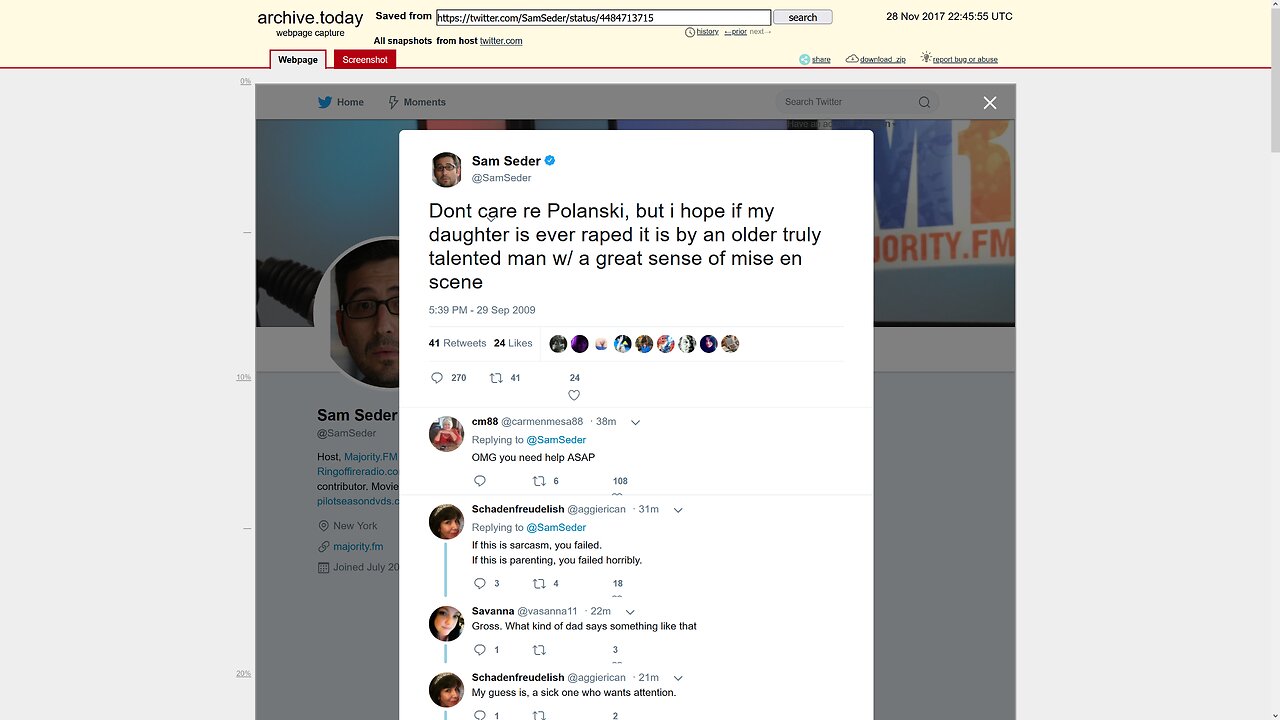
Creepy old man Sam Seder (who had an odd fantasy about his own kid & Roman Polanski https://rumble.com/vcj22f-face-bloat-stan-seder-i-mean-sam-seder-vs.-face-bloat-stan-seder.html ) wants your children to be dysfunctional, which makes it more likely they’ll vote Democrat.
Without any further delay, let us examine many of the government school districts I covered in the first two links above – it’s no surprise that the most dangerous jurisdictions in America also have poor government school districts, churning out SJWs year after year after year in a city w/ stratospheric murder rates year after year after year & these communities are dying.
These communities are the backbone of the Democrat Party. IT IS IMPERATIVE REPUBLICANS THAT IF TRUMP WINS IN NOVEMBER & WE HAVE CONGRESS, THE FEDERAL DEPARTMENT OF EDUCATION MUST BE SHUTTERED!!
No more polishing a turd, no more reforming a mess, it’s time to put out the fire & replace it with nothing. Just as Roe v. Wade was replaced w/ Federalism, we must end the federal department of education & leave this to the states.
States likes Iowa & Idaho will push for more school choice programs & STCs. States like California & Maryland will talk to 10-year-old boys about having their penis removed so they can “become” women. Sorry your honor, I digress.
Some of the most violent cities in America that are run by Demoncrats also have some of the worst government school districts & that, combined w/ a dearth of fathers is a recipe to turn 1950s Detroit into modern-day Detroit.
***
Here’s some sobering data on chronic absenteeism https://nces.ed.gov/forum/pdf/S2016_Chronic_Absenteeism.pdf Asian students tend to be absent less than all other races, American Indians/Alaska Natives (AI/AN) & Blacks are usually leading the way in chronic absenteeism. “Students of color” are absent much more often than Whites & Asians, I would wager much of that is because daddy is not around. You can call me racist, you cannot call me wrong https://nces.ed.gov/programs/raceindicators/indicator_rcc.asp https://nces.ed.gov/nationsreportcard/blog/attendance_and_naep_2022_score_declines.aspx https://nces.ed.gov/whatsnew/press_releases/07_06_2022.asp https://ies.ed.gov/ncee/edlabs/regions/midatlantic/pdf/REL_2017252.pdf https://nces.ed.gov/pubs2010/2010015/indicator4_16.asp https://nces.ed.gov/pubs2007/2007039_2.pdf https://www.sciencedirect.com/science/article/abs/pii/S002244051730122X https://www.attendanceworks.org/chronic-absence-remained-a-significant-challenge-in-2022-23/ You’ll see as absences rise, test scores for Blacks decline much faster (higher % decline) than for Whites. You will also notice that as absences for Asians increase (3 or more) their test scores decline rapidly.
I will mention this often, so do not roll your eyes – it’s to pound it into your brain. These COVID plandemic lockdowns did beaucoup damage to children, particularly “Students of Color” & Districts already struggling (because racism & stuff – the mountains of data I am about to give you will prove this beyond reasonable doubt). https://www.chalkbeat.org/indiana/2023/10/4/23903619/indiana-chronic-absenteeism-rates-attendance-test-scores-student-performance/ https://www.chalkbeat.org/colorado/2023/10/4/23904009/colorado-chronic-absenteeism-increase-2022-2023-attendance/ https://www.chalkbeat.org/2022/10/13/23403250/chronic-absenteeism-pandemic-attendance-quarantines/ https://www.chalkbeat.org/detroit/2023/7/12/23791935/detroit-public-schools-dpscd-chronic-absenteeism-covid-quarantine-decline/ https://www.chalkbeat.org/chicago/2022/12/19/23512704/illinois-chronic-absenteeism-covid-mental-health/ https://www.chalkbeat.org/newyork/2023/9/6/23862246/nyc-public-school-chronic-absenteeism-pandemic/ Even groups not typically seeing this as an issue & rural Districts saw issues arise. This was a dark time in American Education & instead of insisting the group w/ the lowest risk to COVID be there for in-person learning, the Democrats (primarily) fought tooth-and-nail to keep schools closed. More School Choice would remedy a lot of this.
Even the groomers & creeps at the ACLU recognized that dropout factories & chronic absenteeism https://www.aclu.org/news/smart-justice/dropout-factories-and-school-prison-pipeline was a huge issue over a decade ago, but it’s due to racism of course. Yes, “students of color” are not showing up for school at much higher rates than Asians & Whites because of some Machiavellian, shadowy scheme against them.
Of course, the ACLU also fights like hell when parents of “students of color” are given options other than the crumbling https://www.aclufl.org/en/press-releases/aclu-florida-statement-passage-universal-private-school-voucher-bill https://www.aclu.org/press-releases/plaintiffs-ask-tennessee-court-halt-unconstitutional-voucher-program https://www.aclusc.org/en/news/state-house-dispatch-march-4-2024 government school their kids are currently attending, which is full of kids who do not want to be there & when they are there, they cause problems.
https://www.edchoice.org/engage/why-the-aclu-is-afraid-of-school-vouchers/ The ACLU realizes the same thing all Communists do, choice, especially in the arena of education (and empowering parents to layeth the smack down when Districts are trying to brainwash children) takes control away from Leviathan & gives it to those stupid parents who do not know any better.
The ACLU wants no choice in the area of education, they want universal preschool so they can start brainwashing early. They don’t want black kids that can balance their checkbook & are good w/ their hands – those pronouns are most important. More Hispanics are identifying as “conservative” or at least not “liberal” (and “liberal” to me is more “classically liberal” or Libertarian, so who knows if the pollster & polltaker even agree on those terms) & they would like school choice. They would like to get their kids out of a pathetic government school & into a private or charter school.
Dan Bongino had an epic rant some time ago & he observed in his typical fiery fashion that the Democrats are obsessed about talking to your kids about sex. My wife & I will take care of that, stay away from my kid. Democrats want to put the idea of “gender reassignment” in the head of your child because under normal circumstances, they won’t entertain that idea.
Kids are impressionable, which is why predators often go into fields that will allow them access to children. Then they can talk to them about sex, talk to them about being homosexual & it’s either because they want to damage them psychologically (which makes them a more likely participant in the permanent underclass) and/or molest them.
The ACLU is coming for your children, vote these child predators in the Democrat Party out.
Milton Friedman observed back in the 1980s that many government schools, especially in “diverse” & decaying urban areas are just centers to keep kids off the street.
Asian kids (whose ancestors were interned during WWII) aren’t being absent from school & causing issues at school because when they get home, they’ll deal w/ daddy (when he gets home from his high-paying job) & they would rather not piss him off.
There are a lot of kids who are doomed because daddy is not around (single mothers, don’t take that as a jab, but every kid does better w/ 2 stable parents) & the government schools in some places are bad enough, but many of these kids don’t even make it in the door. Democrats made it possible for a woman to marry the government instead of a good man, this has been an atrocity towards (particularly) young black men.
The Every Student Succeeds Act was passed & one of the cornerstones of that pile of dung was to reduce chronic absenteeism. Looks like COVID gave it a knockout punch & shutting down these schools did MAJOR DAMAGE. The Republicans are not without guilt on some of this, but in Iowa, Kim Reynolds & the legislature had to fight like hell more than a year after the plandemic started to get government schools open for in-person instruction. The Democrats did not want this as it hamstrung their efforts to expand the permanent underclass.
Those missed school days wrecked millions of kids that Bernie Sanders will now come up to & tell them they’ll get $20/hr. for slicing the lunch meat, which means they will have no job. But don’t worry, Bernie is going to vote you a check from the public treasury. This was done on purpose; they don’t give a damn about those kids.
Chronic absenteeism was already claiming the careers of enough kids, these plandemic lockdowns put that into overdrive and again, THIS WAS ALL DONE ON PURPOSE! It is not incompetence, it was contrived, it was planned, it did a lot of damage. I digress.
Here’s data on graduation rates by state & nationally, https://nces.ed.gov/programs/coe/indicator/coi https://nces.ed.gov/fastfacts/display.asp?id=805 https://nces.ed.gov/programs/digest/d22/tables/dt22_219.46.asp https://nces.ed.gov/programs/digest/d21/tables/dt21_219.10.asp https://nces.ed.gov/blogs/nces/post/what-is-the-difference-between-the-acgr-and-the-afgr here’s some sobering data on the % of each states’ residents that failed to finish 9th grade. https://rumble.com/v1dmq69-brian-tyler-cohen-is-not-very-bright-part-v.html You will likely notice that states that have been ravaged by illegal immigration tend to have a high % of residents that did not finish 9th grade.
Here's data on status Dropout Rates by race https://nces.ed.gov/programs/coe/indicator/coj/status-dropout-rates & a little ditty I penned many moons ago calling out Story County, Iowa Supervisor Latifah Faisal https://web.archive.org/web/20230830001619/https://professor_enigma.webs.com/latifah-faisal-story-county when she had an bi-polar fit over my opposition to open borders (Which focuses a lot on Status Dropout Rates by Race). This will cause our education system to be stretched to its limit as more resources (and many of these sanctuary cities already have broken & corrupt government education systems) are devoted to ELLs & a huge chunk of them will become a permanent underclass – just what Latifah Faisal wants. She does not want merit, she wants more voters that do not work.
Here's data on out-of-school suspensions & expulsions by race; “students of color” (Blacks, Hispanics, males) tend to be suspended the most often & that is of course a product of racism, not bad behavior caused by a train wreck of a home life where daddy is absent. Males (and particularly Black males) get suspended much more often than females, no surprise that males commit ~85% of violent crimes & murders. When it comes to Black males, the disproportion grows even more compared to other groups. Surprised? Asians (Pacific Islanders are usually separated from Asians) get the fewest suspensions & expulsions, likely because there are more fathers in the home meting out discipline when necessary. Every child needs a good father, not only because that is another income stream, but because he will teach him how to be a good man. Sam Seder was absent for much of his kids’ development, likely because his father was aloof & had no time for him. Sam Seder is also a creepy old man who wants fathers that oppose predators talking to their children about “transgenderism” & homosexuality silenced. Don’t be Sam Seder! https://nces.ed.gov/programs/raceindicators/indicator_rda.asp https://nces.ed.gov/programs/digest/d22/tables/dt22_233.30.asp https://ies.ed.gov/ncee/edlabs/regions/midatlantic/pdf/REL_2014017.pdf https://nces.ed.gov/programs/digest/d23/tables/dt23_233.28.asp https://nces.ed.gov/programs/digest/d23/tables/dt23_233.40.asp https://nces.ed.gov/programs/coe/indicator/a18/serious-disciplinary-actions https://nces.ed.gov/programs/coe/pdf/2021/a18_508c.pdf https://nces.ed.gov/programs/digest/d03/tables/dt147.asp https://nces.ed.gov/pubs2009/2009081_3.pdf https://nces.ed.gov/pubs2010/2010015/indicator4_17.asp
Just as all states are not created equal when it comes to crime & there is massive variation in murders per capita across cities & counties, all government school districts are not created equal either.
***
https://nces.ed.gov/Programs/Edge/ACSDashboard/2614520 https://nces.ed.gov/ccd/districtsearch/district_detail.asp?Search=2&ID2=2614520 Flint, Michigan: Families with Food Stamp/SNAP benefits (54.5%), Parents (of children in Government school) not in the labor force (24%), Children in Government School living w/ a married couple (25.2%) & Children in Government School living in a single parent household (65.1%). The latter was added because NCES has a category for couples that are not married, but cohabitating.
National Averages on those metrics: Families with Food Stamp/SNAP benefits (19.3%), Parents (of children in public school) not in the labor force (16.5%), Children in Government School living w/ a married couple (63.3%)
https://www.flintschools.org/page/annual-education-reports (Useless) https://www.mischooldata.org/annual-education-report-1/ https://www.mischooldata.org/graddropout-rate https://www.mischooldata.org/annual-education-report-1/#NAEP https://www.mischooldata.org/student-attendance Graduation years 2017-2022, Flint has an dropout rate (4-year Cohort) well north of 20%. It’s been this way for a long time. School years ending 2020-22, more than half of Flint’s students failed to graduate on time.
Figured out why Flint votes Democrat yet? This is what the Democrats want. They want fragmented families, they want your children to be considering “gender reassignment” & they don’t want them learning math & science, they want SJWs. I should also mention most of Flint’s children are doomed when they walk into the school because daddy is not around.
In Evidence-Based Reading & Writing (EBRW) for school years ending in 2022 & 2023, ~80% of Black students (and this goes for Flint schools en masse) were not proficient. Black students in Flint are doing much worse than Black students in Michigan statewide.
For school years ending 2022 & 2023 (on average), ~80.7% (missing 10% of school days) of Flint’s student body was “chronically absent.” Holy Balls of Fire Batman! Sounds like little Timmy likely has a crummy life at home. If you don’t even make it to school, you will not succeed. As Wayne Gretzky said, “You miss 100% of the shots you do not take” & being absent from school is putting no shots on goal.
Flint City is 56.3% Black, the student body is 56.7% Black.
https://nces.ed.gov/ccd/districtsearch/district_detail.asp?Search=2&ID2=2601103 https://nces.ed.gov/Programs/Edge/ACSDashboard/2601103 (see also other links for Flint) Detroit, MI: Families with Food Stamp/SNAP benefits (54.9%), Parents (of children in Government school) not in the labor force (27.3%), Children in Government School living w/ a married couple (29.6%) & Children in Government School living in a single parent household (60.2%).
In all school years ending 2013-22, Detroit’s 4-Year Dropout Rate has been in single digits one solitary time & usually it’s north of that by quite a margin. Detroit exceeds the state dropout rate BIGLY. School years ending 2020-22, >30% of Detroit kids fail to graduate on time.
In English (EBRW, 8th grade) Detroit’s Black Students lag behind the state, >78% (schools years ending in 2022 & 2023) are not proficient. If you cannot read proficiently, if you cannot comprehend what you are reading, you will likely not be good at math, science or much else.
For school years ending 2022 & 2023, >70% of Detroit’s student body was “chronically absent.” See how they’re churning out Democrat voters. There is no conspiracy against Blacks nationwide or in Detroit. They attend one of the worst school districts in the nation & they cannot even get in the door!
If you pull this crap at a real job you will not be there long because you’re not dependable. Capiche? Is “systemic racism” causing children in a majority Black school district to NOT even get to school or is it a rotten culture?
There is a nasty, rotten culture in Detroit, the Democrat Party is okay w/ that because that’s one of their strongholds. Detroit City is 77.8% Black, the student body is 77.5% Black.
https://nces.ed.gov/Programs/Edge/ACSDashboard/2628740 https://nces.ed.gov/ccd/districtsearch/district_detail.asp?Search=2&ID2=2628740 Pontiac, MI: Families with Food Stamp/SNAP benefits (39.9%), Parents (of children in Government school) not in the labor force (18%), Children in Government School living w/ a married couple (36.2%) & Children in Government School living in a single parent household (49%)
For school years ending 2019-2022, Pontiac’s dropout rate is >16%, roughly twice the state average. School years ending 2020-22, about 40% of Pontiac’s students do not graduate on time.
English (EBRW, 8th grade), >85% (school years ending 2022 & 2023) of Black pupils are not proficient. Three-quarters of students Districtwide are not proficient.
Pontiac City is 49% Black, the student body is 38.2% Black.
https://nces.ed.gov/Programs/Edge/ACSDashboard/2616440 https://nces.ed.gov/ccd/districtsearch/district_detail.asp?Search=2&ID2=2616440 Grand Rapids, MI: Families with Food Stamp/SNAP benefits (30.7%), Parents (of children in Government school) not in the labor force (17.5%), Children in Government School living w/ a married couple (47.4%) & Children in Government School living in a single parent household (40.4%)
English (EBRW, 8th grade content) for school years ending 2022 & 2023, <25% of Black Students were proficient – Blacks in that District lag behind Blacks statewide as do all students. Who’s at fault for Black children doing poorly in Grand Rapids? Is it the corrupt, inefficient government school district and/or the homes many of these children are being raised in?
Oddly, White children in that District are doing much better than Whites statewide. Why is that?
Since the beginning of the COVID con plandemic, Pontiac’s chronic absenteeism rate has rocketed into orbit. For school years ending 2022 & 2023, it averaged >68%. They cannot even get in the door; how do they expect to succeed?
Grand Rapids’ Dropout Rate (school years ending 2019-22) averaged 9% & 79% of pupils graduated on time. It’s not nearly the train wreck Detroit is.
Grand Rapids is 17.9% Black, the student body is 17.6% Black.
https://nces.ed.gov/Programs/Edge/ACSDashboard/2619950 https://nces.ed.gov/ccd/districtsearch/district_detail.asp?Search=2&ID2=2619950 Kalamazoo City, MI: Families with Food Stamp/SNAP benefits (30.5%), Parents (of children in Government school) not in the labor force (16.2%), Children in Government School living w/ a married couple (44.9%) & Children in Government School living in a single parent household (42.2%)
English (EBRW, 8th grade) for school years ending 2022 & 2023: No surprise here, this District lags behind the state for all students & Blacks (>76% are not proficient) also lag behind the state. Whites in this District also outperform Whites statewide. Odd? Is it possibly because the life they live at home is much less turbulent than Black children in Kalamazoo or is it racist to point that out?
For school years ending 2019-22, >10% of Kalamazoo kids dropped out & ~28% of students do not graduate on time. More than half of all students were “chronically absent” in 2022-23 & the previous year it was more than 27%. Not nearly as bad as our previous contestants, but not exactly anything to shout about.
Michigan’s Chronic Absentee rate has spiked since the COVID con (school years ending 2022 & 2023), it’s more than a third of all students!
The city is 22.1% black & the student body is 19.3% Black.
https://nces.ed.gov/Programs/Edge/ACSDashboard/2929280 https://nces.ed.gov/ccd/districtsearch/district_detail.asp?Search=2&ID2=2929280 St. Louis City, MO: Families with Food Stamp/SNAP benefits (39.9%), Parents (of children in Government school) not in the labor force (17.5%), Children in Government School living w/ a married couple (36%) & Children in Government School living in a single parent household (56.6%)
https://apps.dese.mo.gov/MCDS/Visualizations.aspx?id=22 https://apps.dese.mo.gov/MCDS/Visualizations.aspx?id=29 The City of St. Louis is marred w/ crime & their government school district is in the same boat. According to the Missouri Dept. of Elementary & Secondary Education less than half (49.4%, 2022-23) of all St. Louis City students were in school 90% of the time or more. In 2021-22, only 46.3% of St. Louis Students were in school 90% of the time & in 2020-21 it was exactly 50%. Black students are always suffering from the worst chronic absentee rates, Asians & Whites have the best rates.
For you Democrats listening, this homicide-ridden hellhole that is hemorrhaging population has over half its students missing more than 10% of the school year. Wonder why the city is a wreck? This is done on purpose. Timmy does not know how to read or balance his checkbook, but he knows his pronouns.
The entire student body is eligible for free or reduced-price lunch. Democrats have been running this city for 60 years! Their dropout rate is 10.5% (State avg. = 1.8% for 2022-23), Blacks are at 10.8% & Hispanics at 16.9%. St. Louis’ dropout rate is typically many times higher than the MO rate.
On all demographic metrics, St. Louis City’s graduation rates lag behind MO statewide. Typically, (for school years ending in 2019 to 2023) 22% of Black students do not graduate in 5 years, which is much lower than the state average. Only 77.6% of St. Louis students (school years ending 2021-2023) graduated in 5 years.
For 2022-23, 43.5% of students were “Below Basic” in English Language Arts, only 21.2% were proficient or advanced.
St. Louis City is 43.9% Black, the Student Body is 44.6% Black.
https://nces.ed.gov/Programs/Edge/ACSDashboard/2916400 https://nces.ed.gov/ccd/districtsearch/district_detail.asp?Search=2&ID2=2916400 (see also links for St. Louis) Kansas City, MO: Families with Food Stamp/SNAP benefits (28.3%), Parents (of children in Government school) not in the labor force (15.7%), Children in Government School living w/ a married couple (44.6%) & Children in Government School living in a single parent household (44.4%)
Missouri Assessment Program Statistics (2022-23 school year) indicate 39.4% of KC, MO students are “below basic” in English Language Arts, only 22.2% are “proficient” or “advanced.” 49.9% of the student body is “below basic” in Math. Why do they vote Democrat? Hmmm
The % of KC students that are below grade level in English Language Arts tend to be twice as high as the state average.
46.3% of the student body is “chronically absent” (another page says 47%) from school (2022-23 school year) & all are eligible for taxpayer-subsidized lunch. Blacks tend to be chronically absent more than other races statewide & in KC. Attendance rates in KC for all races tend to be much worse than statewide averages. I wonder if the COVID lockdowns Democrats agitated for (and many Republicans went along with) were good for the economic outlook in KC?
21.3% of students do not graduate in 4 years & almost 20% of Black students (school years ending 2021 through 2023) do not graduate in 5 years, which is far below the state average. All races in KC graduate in 5 years at a much lower rate than MO Statewide.
6.4% (school years ending 2021 through 2023) of Black students dropped out in KC, which is much higher than the state avg. KC students tend to drop out at much at rates 300% higher than MO statewide. Surprised?
Kansas City, Missouri is 26.2% Black, the Student Body is 35% Black.
Keep in mind, a lot of these websites are interactive & I prefer a state site, that way I do NOT have to look up dozens of districts on their own websites. Therefore, this data cannot be saved per se & I am NOT going to screenshot it all. Sorry!
https://nces.ed.gov/ccd/districtsearch/district_detail.asp?Search=2&ID2=5509600 https://nces.ed.gov/Programs/Edge/ACSDashboard/5509600 Milwaukee City, Wisconsin: Families with Food Stamp/SNAP benefits (43%), Parents (of children in Government school) not in the labor force (19.3%), Children in Government School living w/ a married couple (36.1%) & Children in Government School living in a single parent household (52.1%). Marriage is the great poverty eliminator & there’s not a lot of that going on in Milwaukee City.
https://apps2.dpi.wi.gov/reportcards/ https://apps2.dpi.wi.gov/reportcards/get-file?level=district&distKey=004387&fileName=DRCDetail_Public_Milwaukee_2022-23_004387.pdf
For school years ending 2020 through 2022, 42.8% of the Milwaukee Student Body was “chronically absent.” Statewide it was 17.36%. 54.6% of Black students were chronically absent & 35.85% of Hispanic/Latino. Whites had the lowest rate, 19%.
For English Language Arts (school years ending 2021 through 2023), 54.4% of the student body was “below basic” in achievement, the WI statewide avg. was 26.6%. 66.7% of Black students during that time frame were “below basic” in English Language Arts. It gets much worse when you look at achievement in Mathematics. Exactly 50% of Asians were below basic in Mathematics & 37.9% in English Language Arts. Even Asians are not doing well in Milwaukee Government Schools.
Would you pay a plumber that mucks up 2/3 of the jobs he shows up for? Then why do we keep shoveling money into Milwaukee Government Schools when they’re doing nothing but churning out people who know their pronouns, but they can’t comprehend an instruction manual. They can’t balance their checkbook; they cannot hold a job.
They’re either doing this on purpose or they’re incompetent.
(2021-22 graduation year) 34.7% of Milwaukee students did NOT graduate on time, 38.8% of Blacks & 36.7% of Hispanics. The Statewide avg. was only 9.7% of students NOT graduating on time. Milwaukee, you suck.
https://apps2.dpi.wi.gov/reportcards/get-file?level=district&distKey=004387&fileName=DRCDetail_Public_Milwaukee_2021-22_004387.pdf (2020-21 graduation year) 89.4% of students statewide graduated on time, in Milwaukee it was 63.8%. Only 58.4% of Blacks in Milwaukee graduated on time & 67.4% of Hispanics. About 25% of ELLs do not even graduate in 7 years (!). Dump a few thousand of Joe Biden’s Democrat voters coming over our border unabated & Milwaukee’s Government School System would get much, much worse. They don’t care, they just want warm bodies to vote Democrat.
[NOTE: When I attempted to archive the PDFs for Milwaukee, I kept getting a “file not found” error, so you may have to go to the website, then select “Milwaukee” & go from there]
Over 25% of Blacks in Milwaukee do NOT graduate in 7 years. Think about that. Only 75.7% of Milwaukee Students (school years ending 2021 & 2022) graduated in 7 years, that is an astounding amount of fail, yet they clamor for more money for a “quality” public education. No, we’re not rewarding failure anymore.
Milwaukee City is 38.6% Black, the student body is 38.9% Black.
https://nces.ed.gov/Programs/Edge/ACSDashboard/1709930 https://nces.ed.gov/ccd/districtsearch/district_detail.asp?Search=2&ID2=1709930 Chicago, Illinois: Families with Food Stamp/SNAP benefits (34.8%), Parents (of children in Government school) not in the labor force (18.5%), Children in Government School living w/ a married couple (50.2%) & Children in Government School living in a single parent household (41.4%)
https://www.isbe.net/ilreportcard https://www.illinoisreportcard.com/District.aspx?districtId=15016299025 https://www.illinoisreportcard.com/district.aspx?districtid=15016299025&source=trends&source2=graduationrate https://www.illinoisreportcard.com/district.aspx?source=studentcharacteristics&source2=chronicabsenteeism&Districtid=15016299025 https://www.illinoisreportcard.com/district.aspx?districtid=15016299025&source=trends&source2=iar
Chronic Absenteeism in Chicago is a YUUUGE problem. For school years ending 2021 to 2023 it was 38.2% For school years ending 2018 & 2019 it was 23.5%. I am omitting 2020 because I suspect that the rate was much lower that year because students “participated” via Zoom but didn’t pay much attention. As you can see, the COVID plandemic con caused chronic absenteeism to spike in Chicago.
IL statewide chronic absenteeism rate for school years ending 2021 to 2023 was “only” 26.4%. Statewide chronic absenteeism for all races (years ending 2018 & 2019) was 17.15%.
Black students in Chicago’s vaunted Government Schools were chronically absent at a rate of (school years ending 2021 to 2023) 47%, the statewide avg. for Blacks was 43%. Sobering data indeed.
30.75% of Blacks were chronically absent in Chicago for school years ending 2018 & 2019. Statewide it was 29.15%. Every demographic saw massive spikes 2021-23, relative to 2018 & 2019 (school years ending in). Asians are chronically absent the least by far, followed by Whites & there is a big gulf between those groups & Hispanics & Blacks. Must be racism, eh?
34.43% of ELLs (English Language Learners) were chronically absent school years ending 2021 to 2023. How many more taxpayer dollars will Chicago be begging for to “educate” ELLs streaming over the border that will crowd out dollars from marginal students – some who may succeed if they had an effective school. Over a third of them aren’t getting into the building often enough, so a lot of that money is wasted.
School years ending 2021 to 2023, only 3.66% of students dropped out of school. The state rate was 2.93%.
School years ending 2021 to 2023, the 4-Year Graduation Rate in Chicago was 81.8% & the state rate was 87.23%. For ELLs in Chicago, the 4-year Graduation Rate (years ending 2021 to 2023) was 74.1% & statewide it was 79.9%.
Pertaining to English Language Arts (ELA), (school years ending 2022 & 2023) only 22.65% of Chicago students are “proficient” & statewide it was 32.25%. In Chicago, 13.85% of Black students are proficient & statewide it was a paltry 14.1%. ELLs in Chicago; 6.45% were proficient & statewide it was 8.15%.
Same parameters as the above paragraph, 51.25% of Whites are proficient & 52.2% of Asians (Chicago). Statewide, 42.15% of Whites are proficient & 60.7% of Asians. Why are Asians doing so well, yet other minorities are not? Culture? Whites are more proficient in ELA in Chicago than IL en masse. Culture?
In Chicago, 19% of Hispanics (same school years) are proficient in ELA, statewide it is 20.3%. Must be racism, eh? Only 6.45% of ELLs in Chicago are proficient & statewide only 8.15%.
On just about all metrics I covered (save Whites on ELA proficiency), the Chicago Government School District lags behind IL statewide & usually by large margins.
Pertaining to the Illinois Assessment of Readiness (8th grade), school years ending 2019-2023 (2020 omitted) – in Chicago, 73.9% of all students are not meeting expectations in ELA.
Same metrics as above, 83.2% of Blacks are not meeting expectations, 75.775% of Hispanics, 49.85% of Whites & 42.025% of Asians are not meeting expectations.
This is either done on purpose, spending more time talking to kids about sex & changing their gender, grooming them for homosexuality & the end result is you have an SJW that will never hold a job, but they know their pronouns. If it is not done on purpose, then we need school choice, which is something we need anyways so marginal students can escape these poor schools & have a chance.
Sam Seder defends these ineffective, corrupt school districts because they are creating Democrat voters. Sam Seder wants your children hypersexualized so they end up dysfunctional, which will lead to an expanded permanent underclass, the base of the Democrat Party. Sam Seder is also a creepy old man that had a fantasy about his own kid getting assaulted by Roman Polanski, so aside from wanting to hypersexualize your children, I think he gets off on it.
Some more racism to screech about Regressives: https://www.isbe.net/Documents/2022-Il-Reading-Snapshot-Grade8.pdf https://www.isbe.net/Pages/NAEP.aspx https://www.isbe.net/Documents/naep-2019-read-snap-8.pdf IL NAEP results indicate that 51% of Black pupils in the Land of Lincoln are “below basic,” 35% of Hispanics, only 11% of Asians & 20% of Whites. In 2019, 18% of Whites were “below basic,” 44% of Blacks, only 10% of Asians & 34% of Hispanics.
Chicago is 28.8% Black; the student body is also 28.8% Black. Moving to another school district in IL.
https://nces.ed.gov/Programs/Edge/ACSDashboard/1734510 https://nces.ed.gov/ccd/districtsearch/district_detail.asp?Search=2&ID2=1734510 https://www.illinoisreportcard.com/District.aspx?districtId=04101205025 https://www.illinoisreportcard.com/district.aspx?districtid=04101205025&source=trends&source2=graduationrate Rockford, Illinois: Families with Food Stamp/SNAP benefits (44.2%), Parents (of children in Government school) not in the labor force (18.5%), Children in Government School living w/ a married couple (47%) & Children in Government School living in a single parent household (42%)
For school years ending 2021 through 2023 the districtwide 4-Year Graduation Rate in Rockford City was only 66.3%. For Blacks the rate was 52.6%. For Asians it was 87%, Whites were at 72% & Hispanics at 72.93%. Asians are the only demographic doing well, imagine that. 66.26% of ELLs graduated in 4 years.
For school years ending 2021 through 2023, 53.2% of Rockford’s student body was chronically absent. For school years ending 2018 & 2019, the rate was 31%
For school years ending 2021 through 2023, 66.2% of Blacks were chronically absent, which probably explains why almost half of them do not graduate on time. For Asians the rate was 25.1%, Hispanics were at 49.76% & Whites at 44.1%. 44.36% of ELLs were chronically absent. They’re already behind the 8-ball & they compound that by not even getting in the door.
And as it went in Chicago & across the Land of Lincoln, all demographics saw massive spikes in students being chronically absent in school years ending 2021-23, relative to 2018 & 2019. The COVID con caused millions of students to basically lose years of learning, many of them will never recover. How many marginal students fell through the cracks because some Districts basically shut down in-person learning for a few years? This is done on purpose to expand the permanent underclass to vote Democrat.
For school years ending 2021-2023, the districtwide Dropout Rate was 10.63%. A massive increase from 2018 & 2019. For Whites the rate was (school years ending 2021 through 2023) 7.86%, Blacks were at 15.7%, Asians at 2.4% (2023 N/A) & Hispanics at 8.33%. 7.26% of ELLs dropped out.
Regarding ELA “proficiency”, only 16.9% (school years ending 2022 & 2023) of Rockford’s student body hit that benchmark. Only 6.8% of Blacks were proficient, 41.85% of Asians, 29.9% of Whites & 12.1% of Hispanics. Keep in mind, Rockford City lags WAY BEHIND IL statewide. Over half of Asians statewide are “proficient” in ELA. Only 5.6% of ELLs in Rockford are proficient.
Pertaining to Illinois Assessment of Readiness (ELA), Rockford City lags way behind IL statewide. For 8th graders in Rockford (School years ending 2021 through 2023), 81.83% of students are NOT meeting expectations.
Same metric as above, 90.93% of Black students are not meeting expectations, 56.1% of Asians, 68% of Whites, 86.53% of Hispanics & 97% of ELLs are NOT meeting expectations. What a train wreck & pukes like Sam Seder, Latifah Faisal (Story County, Iowa Supervisor) & Joe Biden want to dump millions of these kids all over the U.S. & even in rural school districts so they can wreck those as well. This is immigration sans merit.
Rockford City is 22% Black, the student body is 18.4% Black.
https://nces.ed.gov/Programs/Edge/ACSDashboard/1713320 https://nces.ed.gov/ccd/districtsearch/district_detail.asp?Search=2&ID2=1713320 https://www.illinoisreportcard.com/District.aspx?districtid=50082189022 https://www.illinoisreportcard.com/district.aspx?districtid=50082189022&source=trends&source2=graduationrate https://www.illinoisreportcard.com/District.aspx?source=studentcharacteristics&Districtid=50082189022 East St. Louis, Illinois: Families with Food Stamp/SNAP benefits (56.5%), Parents (of children in Government school) not in the labor force (13.8%), Children in Government School living w/ a married couple (13.3%) & Children in Government School living in a single parent household (80.9%)
Only 70% (School years ending 2021 through 2023) of East St. Louis students graduate on time. 63.63% (same time frame) of students were chronically absent. Oddly, this is a District that did not see a massive spike in chronic absenteeism, because it was already stratospheric in school years ending 2018 & 2019.
The Dropout Rate (school years ending 2020 through 2023) was 6.93% & “proficiency” in ELA (years ending 2022 & 2023) was only 10.9%. Illinois Assessment of Readiness (8th graders, ELA) found that 87.4% of the Student Body was NOT meeting expectations.
If the Graduation Rate is 70% & you have these sobering statistics in English Language Arts, I call B.S. on the glad-handing over rising U.S. Graduation Rates. A lot of kids are being given a diploma when they’re obviously not ready for college or a trade school, they’re just being churned out to make room for another.
Not all Government School Districts are created equal (attending Government School in rural Idaho or Iowa is much different than having to contend w/ groomers & pedophiles in many of California or Chicago’s schools), but its apparent that in many kids are being handed credentials they do not deserve, nor have earned. This is why large numbers of students entering college need remedial courses, because they are not ready. This is part of the Democrat playbook folks, don’t educate, indoctrinate.
East St. Louis City is 94.6% Black, the student body is 89.7% Black.
https://nces.ed.gov/Programs/Edge/ACSDashboard/3904378 https://nces.ed.gov/ccd/districtsearch/district_detail.asp?Search=2&ID2=3904378 https://education.ohio.gov/Topics/Data/Report-Card-Resources https://reportcard.education.ohio.gov/ https://education.ohio.gov/getattachment/Topics/Data/Report-Card-Resources/Annual-Reports-and-Information/State_Report_Card.pdf https://education.ohio.gov/Topics/Data/Report-Card-Resources/Annual-Reports-and-Information https://reportcard.education.ohio.gov/district/043786 Cleveland, Ohio: Families with Food Stamp/SNAP benefits (57%), Parents (of children in Government school) not in the labor force (21.5%), Children in Government School living w/ a married couple (24.8%) & Children in Government School living in a single parent household (62.2%)
Unfortunately, statewide data is not for the previous school year, I will use what I have. School years ending 2019 through 2021, the 4-Year Graduation Rate in OH statewide = 87.16%. From school years ending 2016 through 2018 = 84.33%.
I get this prompt a lot on OH education sites, “A dropout rate is not part of the Ohio School Report Cards and is not measured for all students” so I have no statewide data.
Pertaining to proficiency in English Language Arts statewide (school years ending 2019, 2022 & 2023) was 61.66% for ALL STUDENTS. For Black students it was 35.9%, Hispanics were at 47.36%, Whites = 69.5%, Asian/Pacific Islander = 74.76% & & ELLs = 39.33%. ELLs are more proficient in ELA in OH than Blacks are. How sad is that? No data on what % of those who are NOT proficient are “below basic” or “basic.”
Some data on chronic absenteeism from state reports: “Research supports that chronic absenteeism — defined as missing 10% or more of school hours for any reason — is one of the primary causes of low academic achievement. While chronic absenteeism remains high, it should be noted that chronic absenteeism declined 3.4% from 2021-2022 (30.2%) to 2022-2023 (26.8%). Whether excused or unexcused, missing too much school has detrimental effects on a student’s learning trajectory. This indicator is key to helping districts and schools identify trends to assist in directing supports geared toward students’ needs… From 2020-2021 to 2021-2022, the statewide rate of students missing at least 10% of their instructional time due to absences increased by six percentage points to 30.2%. Chronic absenteeism has risen across nearly all grade levels, district types and student subgroups. In 2021-2022, the largest increases were in
kindergarten and 12th grade. Students with disabilities and those from economically disadvantaged families also experienced substantially higher chronic absence rates… As expected based on the circumstances created by the pandemic, there also was a notable increase in chronic absence (defined as 18 days [10%] or more of excused or unexcused time not engaged in education activity). In 2020-2021, 24% of Ohio’s K-12 students – almost 380,000 students – were chronically absent. As is the typical pattern for chronic absenteeism, Ohio’s historically underserved and vulnerable students and students in urban areas experienced higher rates of chronic absenteeism than their peers.”
It was not the plandemic that caused chronic absenteeism, it was the response to the plandemic that caused it. The least vulnerable group was forced out of in-person learning, sometimes for years & it hurt marginal kids, it hurt minorities more than middle class Whites & Asians. Well done morons!
For school years ending 2019 through 2022 the 4-Year Graduation Rate in Cleveland’s vaunted Government Schools was 77.425%. The post-plandemic years saw a massive decline & that was done on purpose by scumbags (some Republicans, most Democrats) who told the least vulnerable group to stay home, sometimes for years.
Asians are far ahead in Graduation Rates, leaving Whites, Hispanics & Blacks in the dust.
The latest data from Cleveland indicates that an astounding 56.1% of all students were chronically absent. 58% of Black students, 55.4% Hispanic, 50.1% of Whites, 33.8% of Asian/Pacific Islander & 50.1% of ELLs. Is there a conspiracy against people of color or does the culture of Cleveland just suck? #whitesupremacy is causing over half of all Black & Hispanic students to have something better to do than school, right?
The Democrats want this, the culture of Cleveland is creating a permanent underclass.
The latest data for Cleveland’s Overall Performance Index indicates that 47.7% of its students are “below basic or limited.” For 3rd grade ELA, 42.3% of students were “limited.” In ELA achievement, Asians tend to lead the way, followed by White students, Blacks & Hispanics are way behind.
Fall 2021 Reading Diagnostics, 63.7% of Third Graders are NOT on track & Fall 2022 Reading Diagnostics, 61.4% of Third Graders are NOT on track.
Cleveland trails the OH statewide average on all metrics & usually by large margins. Surprised? Wonder why Cleveland has been hemorrhaging population for over 50 years? It’s a mess. Cleveland is 46.6% Black & the student body is 46.3% Black.
https://www.news5cleveland.com/news/local-news/literacy-in-the-hood-providing-books-to-children-in-clevelands-underserved-neighborhoods https://spectrumnews1.com/oh/columbus/news/2019/05/30/uncovering-functional-illiteracy-in-cleveland It was estimated several years ago that 2 out of every 3 Cleveland residents are functionally illiterate. Despite all this spending, 2 out of 3 Clevelanders cannot read. More money will not solve the problem, school choice will. Are you surprised this city is one of the most Democrat-leaning jurisdictions in the country?
https://nces.ed.gov/ccd/districtsearch/district_detail.asp?Search=2&ID2=3904490 https://nces.ed.gov/Programs/Edge/ACSDashboard/3904490 https://reportcard.education.ohio.gov/district/detail/044909 Toledo, Ohio: Families with Food Stamp/SNAP benefits (40%), Parents (of children in Government school) not in the labor force (20.9%), Children in Government School living w/ a married couple (33.8%) & Children in Government School living in a single parent household (51.1%)
The latest data from Toledo indicates that districtwide, 42.6% of students were chronically absent. 44.6% of Blacks were chronically absent, 47.1% of Hispanics, 19.4% of Asians, 36.8% of Whites & 31.6% of ELLs.
Pertaining to 4-Year Graduation Rates (School years ending 2019 through 2022), the districtwide average was 76.22%. Again, the plandemic shutdowns saved zero children & graduation rates plummeted. Good job retards!
Fall 2021 Reading Diagnostics for Third Graders in Toledo, 66.8% are NOT on track. Fall 2022 Reading Diagnostics says 66.7% of Third Graders are NOT on track. Overall Performance Index for Toledo indicates that 45.5% of students are below basic, aka “limited.” 34.8% of Third Graders are “limited” in ELA.
In ELA achievement, Asians are leaving everyone in the dust, followed by Whites – Blacks & ELLs are bringing up the rear. Toledo routinely lags way behind Ohio statewide averages.
Toledo City is 28.1% Black, the student body is 32.1% Black.
https://reportcard.education.ohio.gov/district/detail/043489 https://nces.ed.gov/ccd/districtsearch/district_detail.asp?Search=2&ID2=3904348 https://nces.ed.gov/Programs/Edge/ACSDashboard/3904348 Akron, Ohio: Families with Food Stamp/SNAP benefits (48.5%), Parents (of children in Government school) not in the labor force (18%), Children in Government School living w/ a married couple (33.7%) & Children in Government School living in a single parent household (55.6%)
The latest Chronic Absenteeism data indicates that 47.4% of all students districtwide have a hard time getting in the door. That is the fault of institutional racism, of course. Blacks have a chronic absentee rate of 54.9%, Hispanics = 45%, Whites = 42.5%, Asians = 19.8% & ELLs = 25%.
For school years ending 2019 through 2022, the 4-Year Graduation Rate districtwide was 82.6%. Asians have the highest 4-Year Graduation Rate, followed by Whites, both are above the district average. Blacks & Hispanics are far behind, institutional racism must be running amuck in Akron.
English Language Arts Achievement has Whites leading the way w/ Asians more than 6 points behind. Blacks & Hispanics are well below the district average, ELLs are actually doing better on that metric than Black students.
Fall 2021 Reading Diagnostics show us that 69.8% of Third Graders are NOT on track. Fall 2022 has 65.5% of all Third Graders NOT on track.
Overall Performance Index indicates 44.2% of students are below basic aka “limited.” Pertaining to ELA Achievement Levels, 28.6% of students are “limited” & 42.8% of students are “proficient” or better. It gets much worse for Mathematics.
How is it that on ELA & Performance Index averages, Akron is well behind state averages, yet their 4-Year Graduation Rate is close to the state average?
Akron is 29.5% Black; the student body is 30.1% Black.
https://reportcard.education.ohio.gov/district/043844 https://nces.ed.gov/ccd/districtsearch/district_detail.asp?Search=2&ID2=3904384 https://nces.ed.gov/Programs/Edge/ACSDashboard/3904384 Dayton, Ohio: Families with Food Stamp/SNAP benefits (48%), Parents (of children in Government school) not in the labor force (22.9%), Children in Government School living w/ a married couple (29.2%) & Children in Government School living in a single parent household (56.7%)
For school years ending 2019 through 2022, the 4-Year Graduation Rate districtwide was 72.15%. Blacks led the way (hardly any Asians in High School in this District) in Graduation Rates.
46.9% of all students were chronically absent, 26% of Asians, 49.1% of Blacks, 43.3% of Whites, 41.6% of Hispanics & 34.7% of ELLs.
Overall Performance Index tells us 50.5% of students are “limited.” In ELA achievement (3rd graders) 40.1% of students are “limited,” only 33.6% of students are “proficient” or better.
Dayton City is 38% Black & the student body is 43% Black.
https://www.caschooldashboard.org/reports/19647330000000/2023 https://www.cde.ca.gov/ta/ac/cm/caschdashboard.asp https://nces.ed.gov/Programs/Edge/ACSDashboard/0622710 https://nces.ed.gov/ccd/districtsearch/district_detail.asp?Search=2&ID2=0622710 Los Angeles, California: Families with Food Stamp/SNAP benefits (23.6%), Parents (of children in Government school) not in the labor force (20.9%), Children in Government School living w/ a married couple (58.3%) & Children in Government School living in a single parent household (30.7%)
https://www.caschooldashboard.org/reports/19647330000000/2023/academic-engagement https://www.caschooldashboard.org/reports/19647330000000/2022/academic-engagement 27.15% of all students (kindergarten through 8th grade) were chronically absent statewide in California (school years ending 2023 & 2022) & the Los Angeles Unified School District average was 35.4%. Most student groups are NOT exemplary on this metric, they fail to get “high” or “very high” attendance. Mediocre at best.
47.9% of Blacks were chronically absent (school years 2023 & 2022), Hispanics = 36.75%, Whites = 25.05%, Asians = 12.85%, Pacific Islander = 43.65%, Filipino = 17.75% & ELLs = 35.95%.
For school years ending 2018 & 2019, 14.25% of students districtwide were chronically absent (state avg. = 9.55%). You can see how the post-COVID plandemic years saw a massive spike in that metric & it hurt minorities a lot.
For school years ending 2018 & 2019 in Los Angeles, 25.85% of Black students were chronically absent. Hispanics = 13.75%, Asians = 5.1%, White = 12.55%, Filipino = 7%, Pacific Islander = 21.1% & ELLs = 13.4%.
For school years ending 2023 & 2022 the statewide 5-Year Graduation Rate = 86.9%. The LAUSD avg. = 84.8%. Blacks graduated on time 84.3% of the time, Hispanics = 84.55%, Whites = 83.7%, Asians = 93.5%, Filipino = 95.7%, Pacific Islander = 92.45% & ELLs = 63.45%. Democrats want to import millions more of these ELLs & even put them in rural districts, they want to do for your rural districts what they’ve done to California en masse.
Typically, <80% of Blacks graduate on time statewide; they do a little better in Los Angeles. For other races, they typically trail the statewide average.
For school years ending 2018 & 2019, the districtwide 5-Year Graduation Rate was 82.4% (statewide average =84.65%). For Blacks (LAUSD) it was 81.55%, Hispanics = 82.2%, Asians = 89.85%, Filipino = 91.4%, Pacific Islander = 85.35%, Whites = 80.15% & ELLs = 59.25%.
For school years ending 2022 & 2023, pertaining to English Language Arts, the L.A. Government School District averaged 31.6 points below standard. The statewide average is 12.9 points below standard.
Blacks (LAUSD, school years ending 2022 & 2023) were a whopping 59.95 points below standard, which is only slightly worse than the statewide average. They are not doing well. Hispanics were 42.2 points below standard (worse than state average), Asians were 63.85 points ABOVE standard, Pacific Islanders were 19.95 points below standard, Filipinos were 40.8 points ABOVE standard, Whites were 26.55 points ABOVE standard (doing much better than the statewide average) & ELLs were a whopping 85.85 points BELOW standard & they are doing much worse in LAUSD than statewide.
There is a gargantuan achievement gap in Los Angeles pertaining to ELA proficiency – Asians, Filipinos & Whites are leaving Blacks, Hispanics & ELLs in the dust.
For school years ending 2018 & 2019, LAUSD (English Language Arts) averaged 26.45 points BELOW standard, the statewide average was only 4.25 points below standard. In LAUSD, Blacks were 54.35 points BELOW standard, Hispanics were 35.5 points below, Whites were 29.05 points ABOVE standard, Asians were 57.7 points ABOVE, Filipinos were 41.95 points above, Pacific Islanders were 8.9 points below & ELLs were 64.15 points BELOW standard. Latifah Faisal (Story County, Iowa Supervisor) wants to dump thousands upon thousands of ELLs in Iowa, which will wreck your fine rural districts just so she can expand the permanent underclass that elects Democrats. Get rid of her in November.
My question at the end of my analysis of L.A. Government schools is this: How can Graduation Rates improve when several races saw chronic absenteeism spike & ELA scores plummeted much further post-COVID con?
Seems odd, unless of course Los Angeles is just churning out an enlarged permanent underclass, which the Democrat Party wants to expand their base. These poor government schools are their greatest weapon & it’s why they fight any non-Government Schooling, the kids are less likely to be passed through if they’re not ready & they’re probably not going to hear about homosexual intercourse from borderline pedophiles who urge them to explore the “fact” that they may not be a little boy, but a little girl.
Many of these kids are functionally illiterate or go to college needing remedial courses because the High School did not prepare them, they just passed them.
https://www.caschooldashboard.org/reports/01612590000000/2023 https://nces.ed.gov/Programs/Edge/ACSDashboard/0628050 https://nces.ed.gov/ccd/districtsearch/district_detail.asp?Search=2&ID2=0628050 Oakland, California: Families with Food Stamp/SNAP benefits (21.2%), Parents (of children in Government school) not in the labor force (21.6%), Children in Government School living w/ a married couple (55.5%) & Children in Government School living in a single parent household (37.4%)
52.7% of Oakland’s Student Body is chronically absent (school years ending 2022 & 2023). Well done clowns! 65.5% of Black students (school years ending 2022 & 2023) were chronically absent, Hispanics = 58.6%, Asians = 30.7%, Filipino = 40.15%, White = 33.1%, Pacific Islander = 81.25% & ELLs = 55.25%. They want millions of these ELLs streaming over the border, coming to a school district near you, they want to turn the U.S. into Oakland. No thanks!
Oakland’s numbers for those chronically absent were way beyond the statewide average for all those groups. It was not even close.
For school years ending 2018 & 2019, 21.75% of the entire student population was chronically absent. Blacks = 33.8%, Hispanics = 22%, White = 10.4%, Asian = 9.95%, Filipino = 17.25%, Pacific Islander = 42.5% & ELLs = 19.55%.
Those COVID shutdowns did a fine job of destroying the academic goals of a lot of marginal students. If they had a good charter or private school to attend, they would do a lot better. This is why Democrats in Iowa were screeching for schools to be closed for in-person learning for years, they know if they can damage these children in their formative years, they’re more likely to end up dysfunctional & that means more Democrat votes.
Pertaining to 5-Year Graduation Rates (school years ending 2022 & 2023) only 75.35% of students graduated on time. For school years ending 2018 & 2019 the districtwide 5-Year Graduation Rate was 75.95%. Always well below state averages. Illegal immigration & immigration sans merit has devastated Oakland. This is what pukes like Joe Biden & Story County, Iowa Supervisor Latifah Faisal want to do to Iowa & the entire country.
5-Year Graduation Rates (school years ending 2023 & 2022) by race: Blacks = 79.25%, Hispanic = 67.15%, White = 88.75%, Asian = 89.55%, Pacific Islander = 84.45%, Filipino = 85.9% & ELLs = 59.15%
5-Year Graduation Rates (school years ending 2018 & 2019) by race: Blacks = 76.3%, Hispanic = 68.55%, Asian = 91%. White = 86.2%, Pacific Islander = 83.15%, Filipino = 90.2% & ELLs = 63.35%
In English Language Arts (schools years ending 2022 & 2023) the District was 59.2 points BELOW standard on average. Not a good trajectory. Same data, but for school years ending 2018 & 2019, the District was 48 points BELOW standard. The COVID years did a lot of damage.
In English Language Arts (schools years ending 2018 & 2019) Blacks were 86.25 points BELOW standard, Hispanics were 70.1 points BELOW, Asians were 6.85 points below (statewide, Asians were 60 points ABOVE standard, which show you how bad Oakland is), Whites were 44.15 points ABOVE (better than statewide), Pacific Islanders were 79.7 points BELOW, Filipinos were 21.25 points BELOW (they are way above avg. statewide) & ELLs were 79.25 points BELOW standard.
In English Language Arts (schools years ending 2022 & 2023) Blacks were 112.55 points BELOW standard, Hispanics were 81.65 points below, Whites were 38.8 points ABOVE standard, Asians were 1.25 points above, Pacific Islanders were 109.3 points below, Filipinos were 5.65 points below & ELLs were 89.85 points BELOW standard. See how Blacks, Pacific Islanders & Hispanics fell even further behind Whites & Asians post-COVID plandemic.
Oakland City is 21.8% Black, 26.6% Hispanic, the Student Body is 21.6% Black & 27.2% Hispanic. It’s a melting pot, dumpster fire & train wreck.
https://www.caschooldashboard.org/reports/39686760000000/2023/academic-engagement https://nces.ed.gov/ccd/districtsearch/district_detail.asp?Search=2&ID2=0638010 https://nces.ed.gov/Programs/Edge/ACSDashboard/0638010 Stockton, CA: Families with Food Stamp/SNAP benefits (51.1%), Parents (of children in Government school) not in the labor force (23.8%), Children in Government School living w/ a married couple (56.2%) & Children in Government School living in a single parent household (31.9%)
Chronic Absenteeism (school years ending 2022 & 2023) was at 37.9% & school years ending 2018 & 2019 it was 17.6% of students districtwide were chronically absent. Those articles you read about millions of kids just disappearing from government schools after the COVID plandemic shutdowns (sometimes for years!) was true.
Chronic Absenteeism by Race (school years ending 2022 & 2023) Blacks = 52.05%, Whites = 47.4%, Hispanic = 41.95%, Asians = 28.15%, Filipino = 22.15%, Pacific Islander = 54.5% & ELLs = 37.3%
Chronic Absenteeism by Race (school years ending 2019 & 2018) Blacks = 31.5%, Hispanic = 16.7%, White = 21.05%, Asian = 8.05%, Pacific Islander = 18.6%, Filipino = 6.15% & ELLs = 12.45%. Look at the massive spike among all groups post-plandemic.
5-Year Graduation Rates Districtwide, school years ending 2018 & 2019 were 78.9% & in school years 2022 & 2023 = 82.6%.
5-Year Graduation Rates (school years ending 2022 & 2023) by race: Black = 78.15%, Hispanic = 82.5%, Asian = 88.95%, Pacific Islander = 91.2%, Filipino = 90.85%, White = 75.9% & ELLs = 72.9%. Pretty poor performance.
5-Year Graduation Rates (school years ending 2018 & 2019) by race: Black = 73.95%, Hispanic = 78.45%, White = 72.8%, Asian = 87.9%, Pacific Islander = N/A, Filipino = 94.7% & ELLs = 70.05%
Pertaining to English Language Arts (school years ending 2018 & 2019), Districtwide they were 58.6 points BELOW standard & school years ending 2022 & 2023 they were 63.65 points BELOW standard. I have a question; how can their 5-Year Graduation rates improve so much in the latter time frame when more pupils were chronically absent & they fell further behind in ELA?
Pertaining to ELA (school years ending 2022 & 2023) Blacks were 96.9 points BELOW standard, Hispanics were 69.7 points below, Whites were 57.85 points below, Asians were 24.2 points below, Pacific Islanders were 52.8 points below, Filipinos were 0.15 points below & ELLs were 94.45 points below standard. All groups except Filipino are uber-bad.
Pertaining to ELA (school years ending 2018 & 2019) Blacks were 89.7 points BELOW standard, Hispanics were 63.95 points BELOW, Asians were 25.75 points below, Pacific Islanders were 40 points below, Filipinos were 2 points ABOVE standard, Whites were 44.4 points below standard & ELLs were 78.57 points below standard.
Again, most groups got worse in ELA achievement & chronic absences, yet their Graduation Rates increased. Odd?
Stockton is 11.6% Black; 45.2% Hispanic & the Student Body is 9.5% Black & 57.3% Hispanic. Another multicultural, diverse melting pot in California going straight down the toilet. The Democrats want it this way, they don’t want kids educated, they want them indoctrinated as they seek to expand the permanent underclass to a level where they will never lose power.
https://nces.ed.gov/ccd/districtsearch/district_detail.asp?Search=2&ID2=0618390 https://nces.ed.gov/Programs/Edge/ACSDashboard/0618390 https://www.caschooldashboard.org/reports/19646340000000/2023/academic-engagement Inglewood, CA: Families with Food Stamp/SNAP benefits (21.8%), Parents (of children in Government school) not in the labor force (16.1%), Children in Government School living w/ a married couple (48.4%) & Children in Government School living in a single parent household (43.4%)
School years ending 2022 & 2023, Districtwide Chronic Absenteeism was at 45.25% of the Student Body. For school years ending 2018 & 2019, it was 18.15%.
Chronic Absenteeism by race (school years ending 2022 & 2023): Blacks = 46.855%, Hispanic = 44.25%, Asian = 46.05%, (White & Filipino not enough students) Pacific Islander = 59.45% & ELLs = 43.25%
Chronic Absenteeism by race (school years ending 2018 & 2019): Blacks = 20.6%, Hispanic = 16.6%, (Asian, Filipino & Pacific Islander not enough students) White = 22.15% & ELLs = 15.5%. Lo
-
 36:50
36:50
The Brett Cooper Show
2 days ago $9.52 earnedWhy Conservatives Are Outraged At Trump & Superman Controversy | Episode 47
32.4K60 -
 16:43
16:43
Blackstone Griddles
1 day ago3 Classic Recipes for New Griddle Owners with CJ Frazier
12.3K2 -
 LIVE
LIVE
VladsGamingCartel
3 hours ago7 Days to Die | Vlad & Tippsy Stream #BadAtGaming
104 watching -
 35:38
35:38
Sam Sorbo
3 hours agoLIVE from TPUSA SAS: Fighting for Parents, Freedom, and the First Amendment
15.2K6 -
 16:09
16:09
Professor Nez
4 hours ago🚨BIDEN'S DOCTOR STONEWALLS: What Are They HIDING?
23.9K17 -
 3:08:37
I_Came_With_Fire_Podcast
13 hours agoThe U.S. is Reverse Engineering UAP Technology Faster Than China
19.6K11 -
 40:27
40:27
The Rubin Report
6 hours agoThis Democrat Is Willing to Be Honest About How They Lost Their Way | Jim Himes
143K114 -
 52:39
52:39
Her Patriot Voice
5 hours ago $2.60 earnedLIVE From SAS with Savannah Craven
25.6K1 -
 1:09:27
Wendy Bell Radio
9 hours agoPet Talk With The Pet Doc
33.6K10 -
 8:12
8:12
Sideserf Cake Studio
6 hours ago $1.24 earnedTake the ULTIMATE Real or Cake Challenge
21K3