Plotting Maps Directly on Excel with Statistics Displayed from Data Tabl
1 year ago
96
Plotting Maps Directly on Excel with Statistics Displayed from Data Tabl
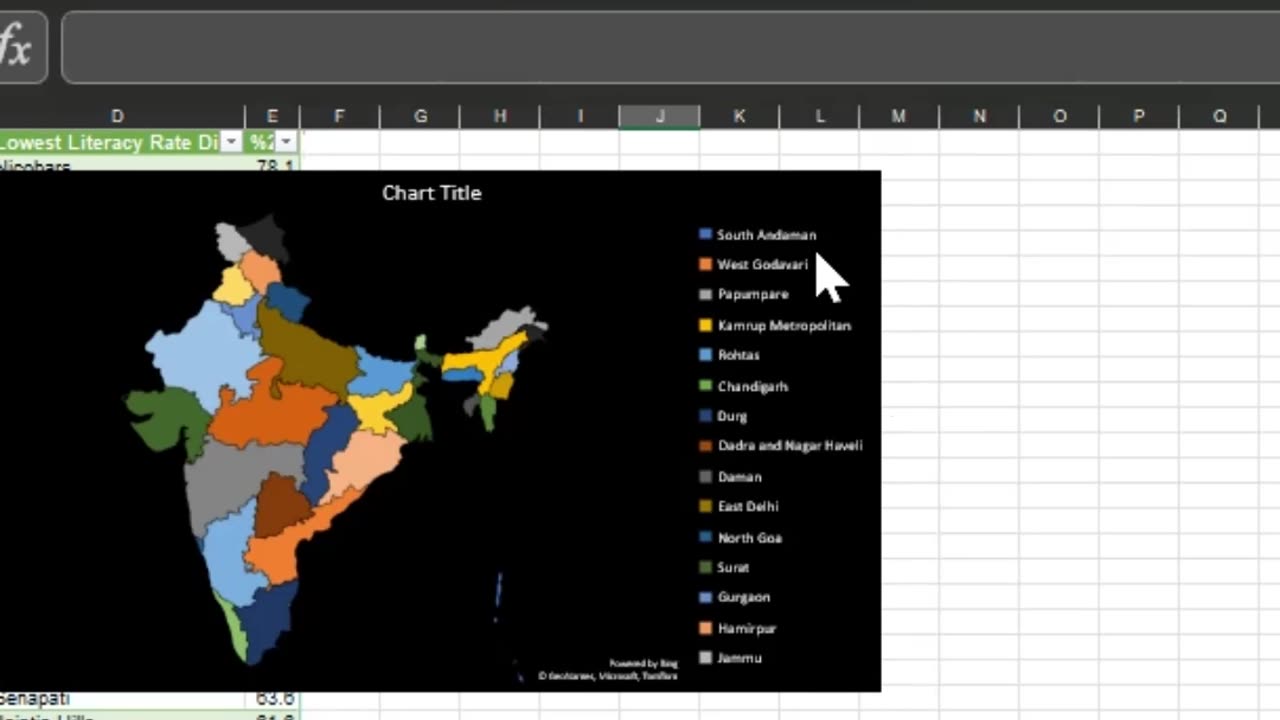
In this video, we'll show you how to plot maps directly on Excel using the power of the Bing Maps add-in. We'll demonstrate how to easily import data from a table and display it on a map, with statistics displayed directly from the data table. You'll see how to customize the map's appearance, add data labels, and even create animated maps. By the end of this tutorial, you'll have a deeper understanding of how to utilize Excel's powerful data visualization capabilities to create insightful maps for your next project
Excel Tips and Tricks - Plot MAP Directly on EXCEL With Statistics displayed from Data Table
Loading comments...
-
 1:07:25
Timcast
1 hour agoBomb DETONATED At Harvard, Attacks On Ice Agents SKYROCKET
47K47 -
 1:55:31
Steven Crowder
3 hours agoTucker Carlson & MAGA: Everyone is Missing the Point
235K203 -
 1:11:22
The Rubin Report
2 hours agoWatch Joe Rogan’s Face as Elon Musk Exposes How Dems Are Cheating in Plain Sight
23.4K38 -
 1:01:07
VINCE
4 hours agoThe Walls Are Closing In On The Deep State | Episode 160 - 11/03/25
183K129 -
 LIVE
LIVE
LFA TV
19 hours agoLIVE & BREAKING NEWS! | MONDAY 11/3/25
3,064 watching -
 1:31:18
Graham Allen
5 hours agoErika Fights Back: Vows To EXPOSE TRUTH & DEMANDS Trial Goes Public!! Left Says Her Grief Is FAKE!
130K79 -
 2:08:47
Badlands Media
9 hours agoBadlands Daily: November 3, 2025 – Tariff Wars, SNAP Panic & Brennan Gets Confronted
53.9K14 -
 2:59:32
Wendy Bell Radio
8 hours agoThings Will Get Worse Before They Get Better
78K100 -
 1:18:28
The Big Mig™
4 hours agoICE Will Use Private Bounty Hunters, LFG
20.1K11 -
 1:08:17
Chad Prather
11 hours agoHow to Get Along With People You Don’t Even Like (Most of the Time)
113K31