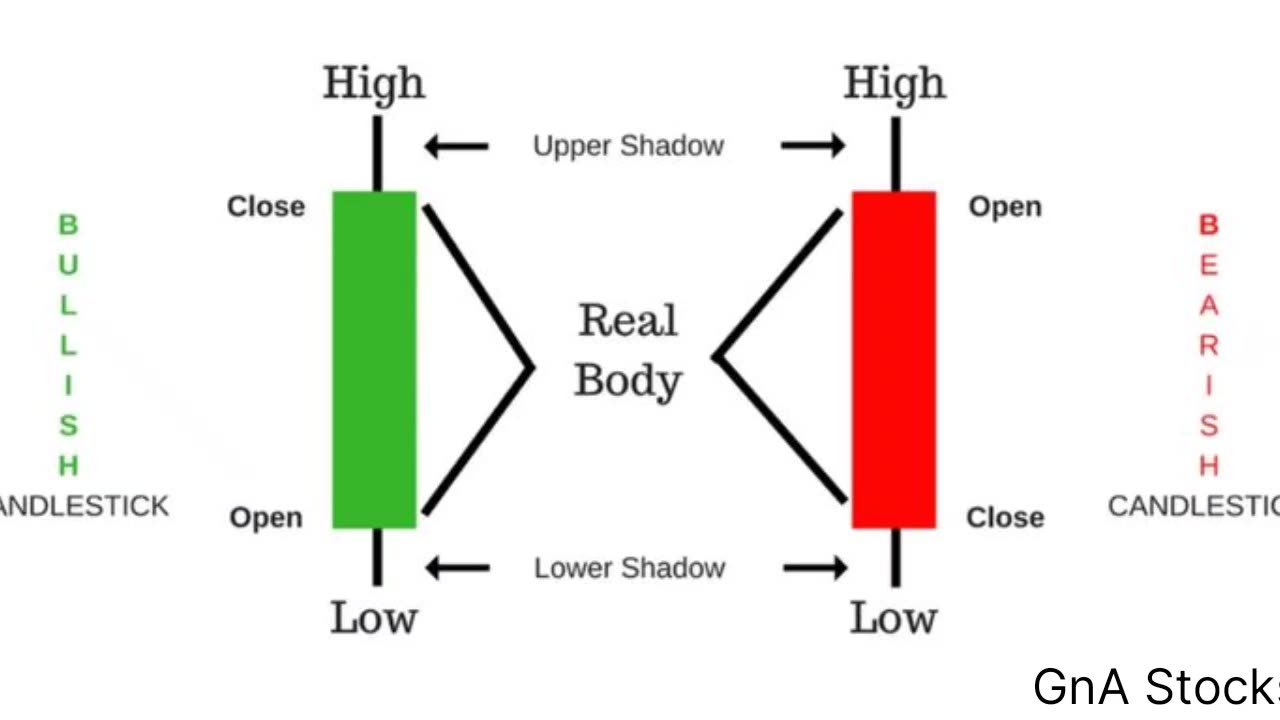
Brief description of candelstick
Loading comments...
-
 LIVE
LIVE
Crypto Power Hour
1 hour agoWEB 3, Reclaiming The Internet
97 watching -
 LIVE
LIVE
Total Horse Channel
31 minutes ago2025 WDAA Western Dressage World Championship Show | Day Two | Arena Four
120 watching -
 LIVE
LIVE
LFA TV
3 hours agoLFA TV ALL DAY STREAM - WEDNESDAY 9/17/25
7,528 watching -
 1:15:33
JULIE GREEN MINISTRIES
2 hours agoLIVE WITH JULIE
44.9K127 -
 LIVE
LIVE
The Bubba Army
23 hours agoState of Utah Wants Tyler Robinson DEAD! - Bubba the Love Sponge® Show | 9/17/25
1,527 watching -
 LIVE
LIVE
JuicyJohns
39 minutes ago🟢#1 REBIRTH PLAYER 10.2+ KD🟢
54 watching -
 29:02
29:02
ChopstickTravel
7 days ago $1.98 earnedToronto's #1 Chilli Crab 🇨🇦 Canada's Seafood Meets China's Wok ft.@InstaNoodls
56.9K1 -
 17:07
17:07
Fit'n Fire
4 days ago $0.65 earned*NEW* Bulgarian RPK Mag That Actually Work?
10.2K5 -
 10:56
10:56
Nicholas Bowling
19 hours ago $2.22 earnedBisexual “Christian” CONFRONTS Preacher on College Campus!
14.5K14 -
 1:57:04
BEK TV
1 day agoTrent Loos in the Morning - 9/17/2025
10.9K