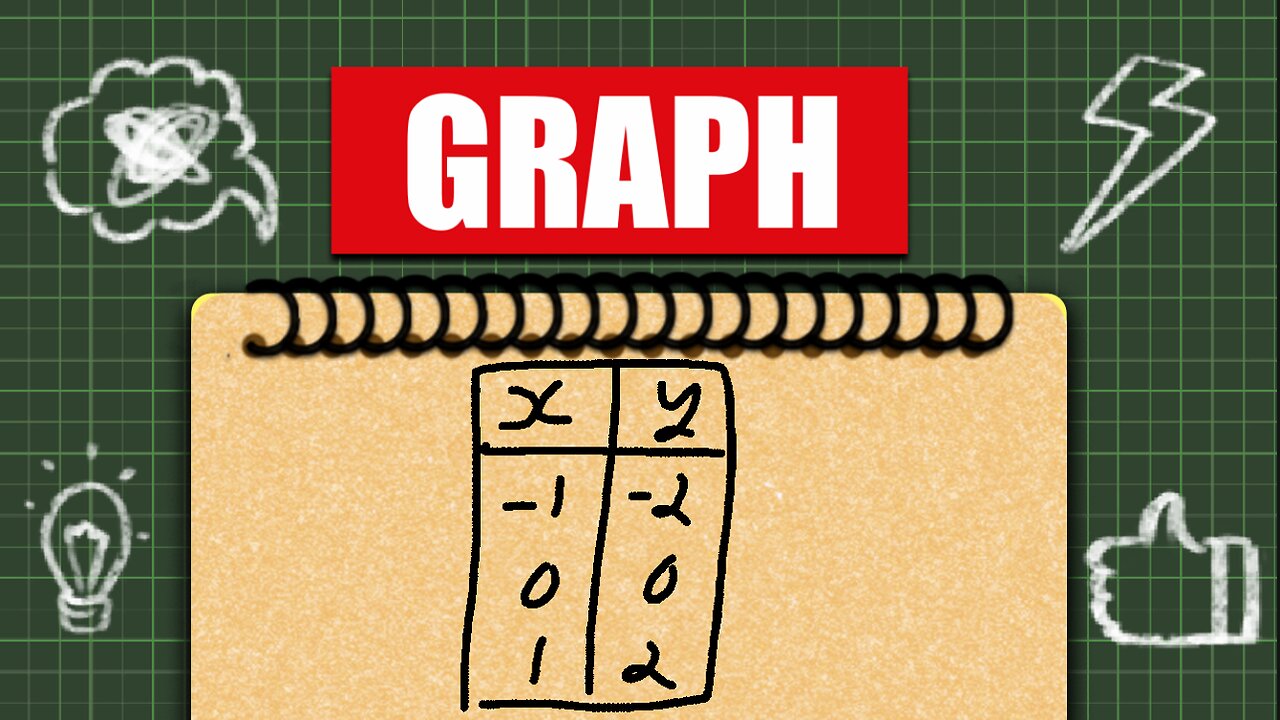
Plotting a linear graph from a table of values
Loading comments...
-
 12:08
12:08
A Numbers Game
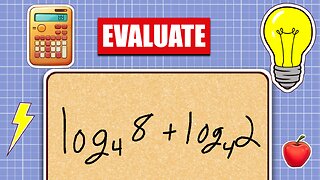
1 year ago $0.06 earnedLog rules
74 -
 LIVE
LIVE
DeVory Darkins
1 hour agoBOMBSHELL: Congress drops BRUTAL NEWS for Tim Walz after Comer announces Probe
16,695 watching -
 LIVE
LIVE
Dr Disrespect
2 hours ago🔴LIVE - DR DISRESPECT - WARZONE x BLACK OPS 7 - SEASON 1 INTEGRATION
1,305 watching -
 34:26
34:26
Misfits Mania
3 hours ago $4.79 earnedMISFITS MANIA: Launch Press Conference
46.2K6 -
 LIVE
LIVE
Sean Unpaved
2 hours agoPlayoff Implications On The Line For Cowboys vs. Lions NFC SHOWDOWN! | UNPAVED
144 watching -
 59:30
59:30
Simply Bitcoin
20 hours ago $0.09 earnedThe Bitcoin Crucible w/ Alex Stanczyk & Daniel Batten - Episode 11
4713 -
 8:44
8:44
Jamesons Travels
15 hours ago $0.05 earnedCongress Created This Mess…Now Troops Pay the Price
2043 -
 1:00:13
Timcast
2 hours agoTrump DUNKS On Somalis, Calls For Ilhan Omar To Be DEPORTED
120K17 -
 2:30:27
Steven Crowder
4 hours agoNick Fuentes Sits Down with Crowder
412K845 -
 1:07:12
The Rubin Report
3 hours agoHost Gets Visibly Angry as Scott Bessent Rips Him to Shreds in Front of NY Times Crowd
46.9K15