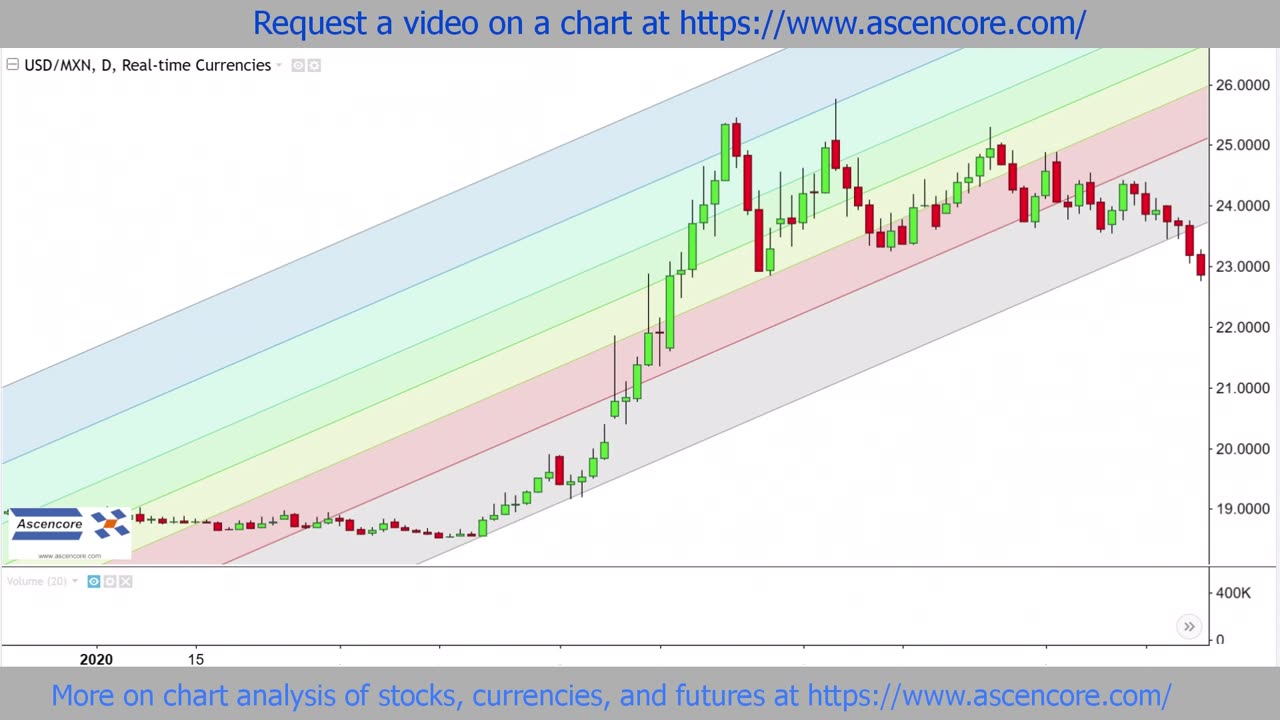
US Dollar To Mexican Peso (USDMXN) Chart Analysis Fibonacci Channel Practice Example
1 year ago
29
Visit https://www.ascencore.com/ for more helpful resources and chart analysis examples.
Copyright © 2024
Produced by Ascencore
Loading comments...
-
 4:03
4:03
Ascencore
4 months agoStock Market News: Gauzy, Gevo, Rigetti, Soundhound, iRobot
163 -
 1:27:11
Omar Elattar
9 hours agoThe Dating Expert: "I've Helped 4,000 Men Find LOVE!" - The #1 Alpha Trait Women Secretly Crave!
20K -
 LIVE
LIVE
VOPUSARADIO
9 hours agoPOLITI-SHOCK! "END THE FED, END THE LIES & END THE DEEP STATE ONCE AND FOR ALL"!
159 watching -
 1:43:38
LumpyPotatoX2
5 hours agoRumble Creator Round-Table - Let's Talk About It
22.2K2 -
 32:38
32:38
The Mel K Show
7 hours agoMel K & Dr. James Thorp, MD | Sacrifice: The Targeting of the Most Vulnerable | 7-24-25
27.6K10 -
 1:12:41
Donald Trump Jr.
6 hours agoFrom Crypto to AI, There's a New American Energy Revival, Interviews with Asher Genoot & Sen McCormick | TRIGGERED Ep.261
155K53 -
 52:11
52:11
ZeeeMedia
9 hours ago"Meaningful Deep State Prosecution" ft. Robert Barnes | Daily Pulse Ep. 73
38.5K8 -
 8:10
8:10
MattMorseTV
7 hours ago $3.22 earnedThey just CAVED.
29.1K25 -
 14:55
14:55
Tundra Tactical
6 hours ago $0.56 earnedTundra's EXPLOSIVE SIG Meme Review
14.5K1 -
 3:01:22
Joker Effect
4 hours agoThe told me to go to H3LL...... well... I am here and causing chaos now. HORROR GAMEPLAY ONLY! :)
13.6K5