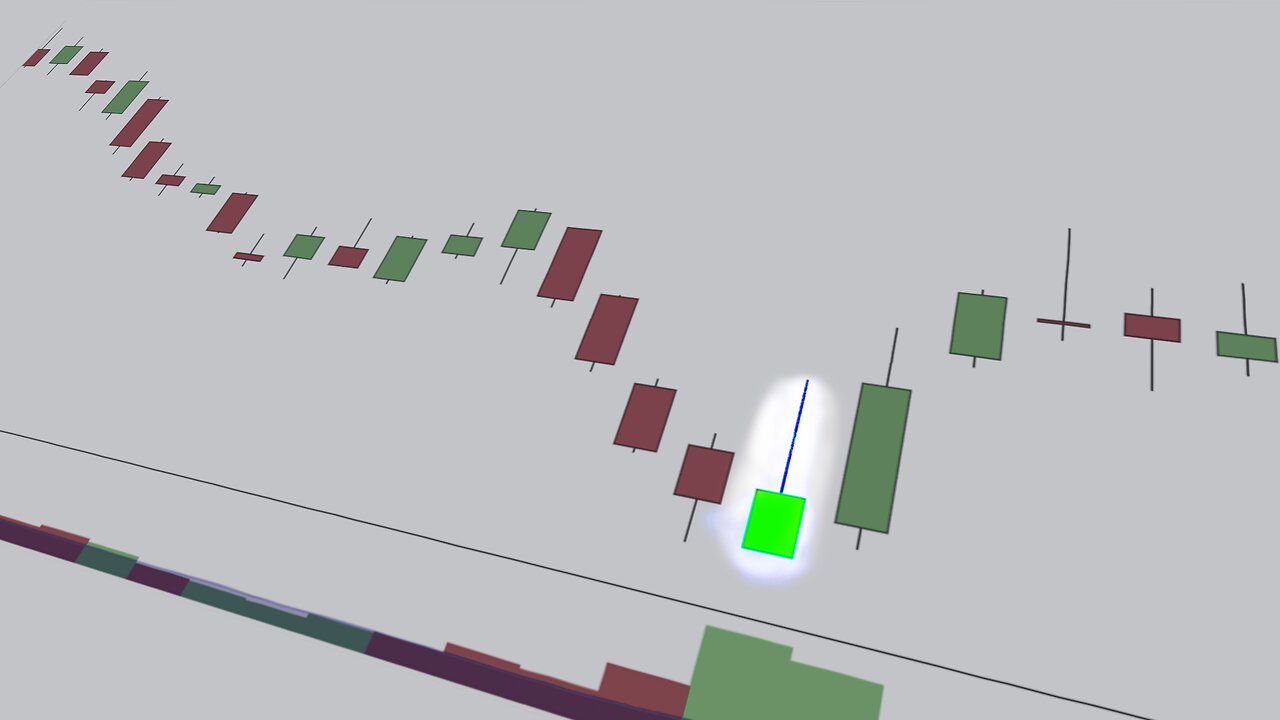
Stock Chart Technical Analysis (Inverted Hammer) Candlestick Chart Pattern Analysis
1 year ago
1
Visit https://www.ascencore.com/ for more helpful resources and chart analysis examples.
Copyright © 2024
Produced by Ascencore
Loading comments...
-
 7:05
7:05
Ascencore
11 days agoAviation Stock Radar: Archer ACHR, Joby Aviation JOBY, Vertical Aerospace EVTL, New Horizon HOVR
61 -
 2:59:36
Wendy Bell Radio
8 hours agoFeeding Their Greed
67.1K79 -
 1:55:12
Badlands Media
10 hours agoBadlands Daily: November 26, 2025
51.8K7 -
 1:13:11
Chad Prather
19 hours agoGratitude That Grows in Hard Ground: A Thanksgiving Message for the Soul
79.3K44 -
 LIVE
LIVE
LFA TV
15 hours agoLIVE & BREAKING NEWS! | WEDNESDAY 11/26/25
3,537 watching -
 1:59:03
The Chris Salcedo Show
16 hours ago $12.62 earnedRemembering Rush On A Truly American Holiday
39.1K3 -
 36:24
36:24
Julie Green Ministries
6 hours agoLIVE WITH JULIE
117K230 -
 1:05:27
Crypto Power Hour
14 hours ago $10.31 earnedWhat You Need To Know About Gold Tokenization
71.6K8 -
 1:46:14
LIVE WITH CHRIS'WORLD
15 hours agoTHE WAKE UP CALL - 11/26/2025 - Episode 14
33.9K2 -
 2:16:19
The Bold Lib
18 hours agoBOLDCHAT: Trump Pardons | DOGE | Patel w/ANGELA BELCAMINO
43.3K8