(BBY) Best Buy Stock Chart Analysis With The Chande Momentum Oscillator & Bollinger Bands
6 months ago
23
Visit https://www.ascencore.com/ for more helpful resources and chart analysis examples.
Copyright © 2024
Produced by Ascencore
Loading comments...
-
 1:44
1:44
Ascencore
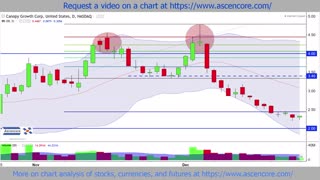
6 months ago(CGC) Canopy Growth Corp Stock Chart Analysis With Bollinger Bands
20 -
 2:58
2:58
Ascencore
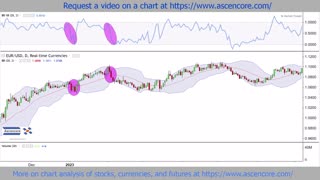
6 months agoForex Chart Analysis With The Bollinger Bands %B Indicator
16 -
 7:38
7:38
RocketRody
2 months agoBitcoin Chart Analysis and Market Commentary 5-8-20254
8 -
 0:10
0:10
Trading_Soldier
6 months agoSee what the charts are telling you, not what you want to see on them!
11 -
 16:50
16:50
RoryStockValues
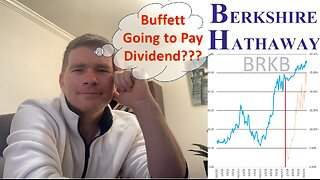
7 months agoBerkshire (BRKB) Can the Conglomerate Outperform the S&P. BRKB Valuation & Machine Learning Forecast
7 -
 1:18
1:18
Alpha Trading : Trading Volatility, Entropy, Probability and Statistics (VEPS)
4 months agoThe World's Best Trading Indicators!
24 -
 6:27
6:27
Mahogany Lore
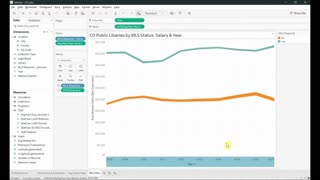
6 months agoVisualizing Data for Libraries: Part 5 - Line Chart
2 -
 4:00
4:00
Day Trading Cryptos
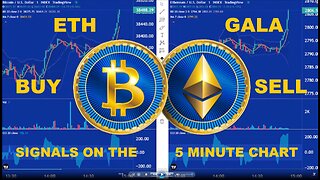
3 months agoBuy + Sell Signals on the GALA 5 Minute Chart
20 -
 6:31
6:31
Nasdog
2 months agoGold -$70, Stocks Commodities bounce, Look at the charts
29 -
 4:47
4:47
Petes Investing
4 months agoNASDAQ Technical Analysis Mar 12 2024
29