Visualizing Data for Libraries: Part 4 - Symbol Map
1 year ago
1
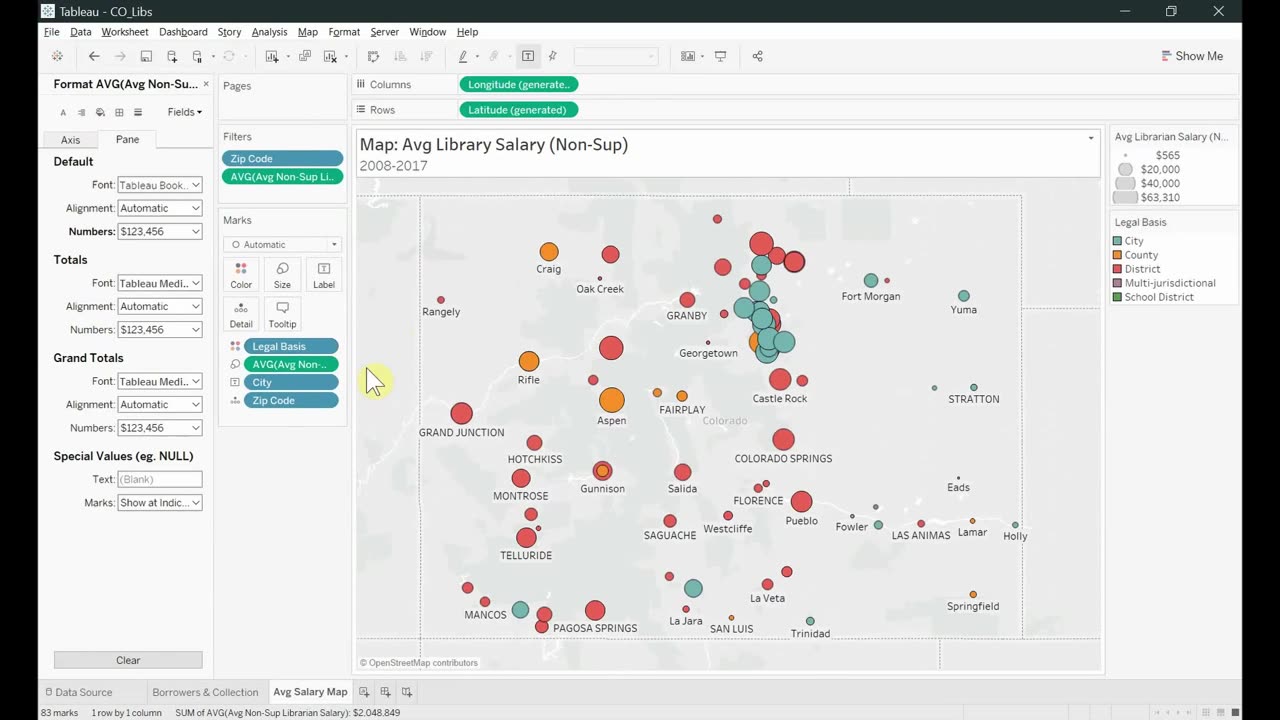
Part 4 of the Visualizing Data for Libraries tutorial, created for Rutgers University's Information Visualization term project as part of the MLIS program. This covers how to create a symbol map in Tableau.
Music:
Happy Ukulele by Scott Holmes is licensed under an Attribution-NonCommercial License. Retrieved from http://freemusicarchive.org/music/Scott_Holmes/Happy_Music/Happy_Ukulele_1026
Loading comments...
-
 2:04:19
Inverted World Live
6 hours agoJoe Exotic Calls From Prison | Ep. 118
61.7K7 -
 56:24
56:24
DeVory Darkins
13 hours ago $53.45 earnedFederal Judge issues shocking order against Trump as Chicago Mayor pulls insane stunt
118K345 -
 1:43:56
Badlands Media
12 hours agoBaseless Conspiracies Ep. 153: Insurrection, Assassination, and the Charlie Kirk Puzzle
41.5K44 -
 23:51
23:51
Stephen Gardner
5 hours ago🚨Trump did the UNTHINKABLE!
35.3K96 -
 2:54:14
Barry Cunningham
8 hours agoBREAKING NEWS: PRESIDENT TRUMP SAYS HE MAY INVOKE THE INSURRECTION ACT! AND NOW WE KNOW WHY!
43K19 -
 40:13
40:13
Clownfish TV
14 hours agoMagic the Gathering Champion BANNED from Tournament Over MAGA Hat?! | Clownfish TV
32.4K21 -
 2:49:47
TimcastIRL
7 hours agoTrump Considers Invoking INSURRECTION ACT To Deploy National Guard to Portland | Timcast IRL
190K113 -
 10:05:38
Dr Disrespect
15 hours ago🔴LIVE - DR DISRESPECT - BLACK OPS 7 - GIVE ME BACK MY NUKE
157K18 -
 4:51:07
Drew Hernandez
5 hours agoTARGETED LEFTIST TERRORIST ATTACK IN CHICAGO & ISRAEL GEOFENCING U.S. MEGA CHURCHES
41.9K9 -
 8:58
8:58
Degenerate Jay
16 hours ago $0.76 earnedXbox Game Pass Is Getting Ridiculous
20.2K2
