How to Break Down a Chart
Loading comments...
-
 0:10
0:10
Trading_Soldier
6 months agoSee what the charts are telling you, not what you want to see on them!
11 -
 22:43
22:43
Instruction Set Trading
2 months agoWeek In Review
30 -
 4:06:18
Instruction Set Trading
2 months agoSaturday Morning Group
45 -
 9:40
9:40
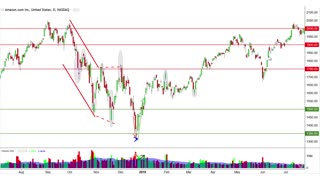
Ascencore
6 months agoAn Example Of Candlestick Charting Analysis With AMZN Stock Chart
17 -
 10:28
10:28
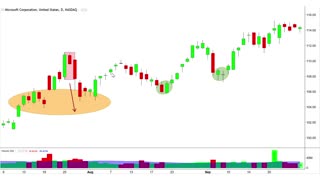
Ascencore
7 months agoHarami (Candlestick Charting Pattern) Example Case Study With MSFT Stock Chart
12 -
 18:49
18:49
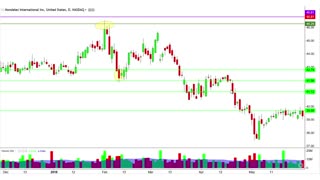
Ascencore
6 months agoExplaining Candlestick Charting Patterns With A Practice Case Study With MDLZ Stock Chart
14 -
 3:51
3:51
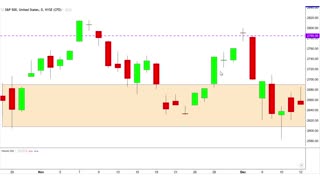
Ascencore
6 months agoPractice Candlestick Charting With A Case Study Of The SPX Chart
20 -
 6:17
6:17
Ascencore
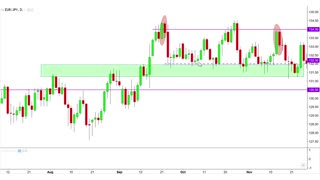
7 months agoEasy Candlestick Charting Pattern Analysis: (Harami) Example Case Study With EURJPY Chart
5 -
 10:54
10:54
Ascencore
6 months agoAssorted Candle Chart Analysis (Practice Case Study) SNAP Stock Chart
36 -
 6:23
6:23
Ascencore
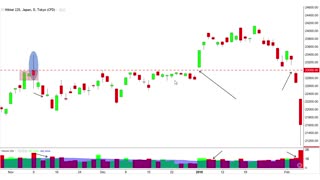
6 months agoPractice Candlestick Chart Patterns: Case Study Example Nikkei
24