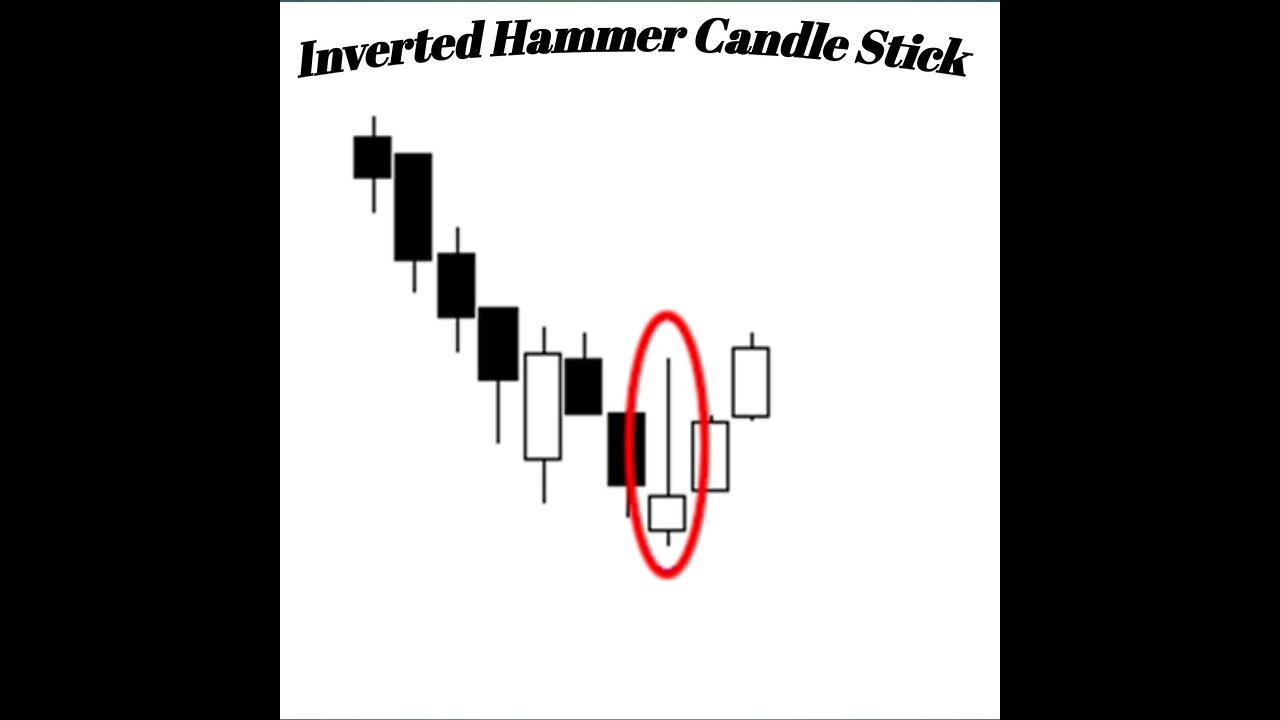
Inverted Hammer Candlestick Pattern: A Bearish Reversal Signal
The inverted hammer is a significant candlestick pattern frequently observed in financial markets. It typically appears at the end of an uptrend, signaling a potential reversal in the stock's price direction. This bearish formation consists of a small body near the low of the session and a long upper shadow, resembling an upside-down hammer.
The inverted hammer suggests that despite an attempt to push the price higher, the bears managed to regain control, driving the price down significantly from its high. This signifies potential weakness and a shift in momentum from bullish to bearish. Traders often view this pattern as an indication of selling pressure and a possible trend reversal, prompting caution or potential short positions.
However, the inverted hammer should be confirmed by subsequent price action or indicators for a more reliable signal. It's essential to consider other technical analysis tools and market conditions to make informed trading decisions based on this candlestick pattern.
Keep in mind that individual candlestick patterns, including the inverted hammer, are more effective when used in conjunction with other technical analysis methods and not relied upon in isolation for making trading choices.
-
 59:43
59:43
Sarah Westall
4 hours agoVietnam Shuts down 86 Million Bank Accounts, The Fourth Turning & more w/ Andy Schectman
46.4K11 -
 1:17:51
Flyover Conservatives
12 hours agoMary Flynn O’Neill and Clay Clark: The Church Must Rise or America Falls | FOC Show
36.8K3 -
 3:36:01
I_Came_With_Fire_Podcast
14 hours agoThe Global ANTIFA Connection You've Never Heard Of | The Israel Question
29.4K6 -
 16:38
16:38
RTT: Guns & Gear
21 hours ago $2.73 earnedExtar EP9 Review: The Best Budget 9mm PCC?
46.6K6 -
 7:53
7:53
Rethinking the Dollar
14 hours agoMass Firings in Tech: The Real Agenda Behind 166,000 Cuts
53.4K11 -
 1:02:28
BonginoReport
9 hours agoFeds Monitor Threats Ahead of Kirk Memorial - Nightly Scroll w/ Hayley Caronia (Ep.138)
260K151 -
 55:51
55:51
Candace Show Podcast
8 hours agoWho Moved The Camera Right Above Charlie's Head? | Candace Ep 239
115K651 -
 13:09:13
LFA TV
1 day agoBREAKING NEWS ON LFA TV! | FRIDAY 9/19/25
263K55 -
 13:00:46
Total Horse Channel
17 hours ago2025 WDAA Western Dressage World Championship Show | Day Four | Arena One
23.9K -
 2:08:52
The Mike Schwartz Show
10 hours agoTHE MIKE SCHWARTZ SHOW Evening Edition 09-19-2025
44.7K4