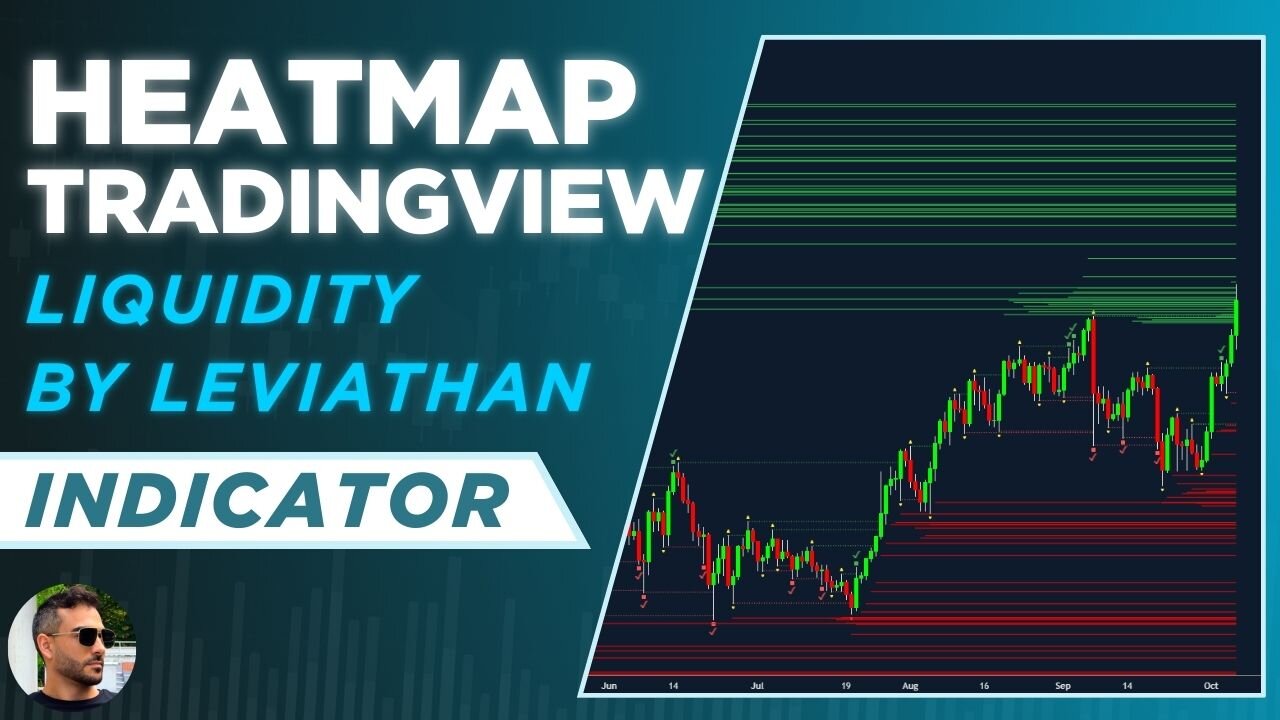
HEATMAP Indicator on TRADINGVIEW - Swing Levels and Liquidity By LeviathanCapital
HEATMAP indicator, now available on TradingView. In this comprehensive guide, brought to you by LeviathanCapital, we'll dive headfirst into the intricacies of the HEATMAP indicator, unveiling its potential to identify crucial swing levels and liquidity within the cryptocurrency market.
Are you an aspiring trader seeking to gain a competitive edge in the dynamic world of crypto? Join us on this educational journey as we break down the HEATMAP indicator's functionality, step by step, from its fundamental principles to its advanced applications.
Discover how this powerful tool can help you make informed trading decisions, providing valuable insights into market sentiment and potential price movements. We'll show you how to effectively interpret the heatmap, spot significant liquidity zones, and leverage this information to enhance your trading strategies.
Whether you're a newcomer to the world of cryptocurrency trading or an experienced trader looking to sharpen your skills, this tutorial caters to all levels of expertise. LeviathanCapital's expertise in the crypto space ensures you receive high-quality insights and guidance.
Don't miss this opportunity to unlock the potential of the HEATMAP indicator and elevate your cryptocurrency trading game. Join us now, and let's embark on this educational journey together.
Please remember that the information presented in this video is for educational purposes only and should not be considered as financial advice. Always conduct your research and consult with a qualified financial professional before making any investment decisions.
Stay tuned for more insightful tutorials and updates from LeviathanCapital, your trusted source for cryptocurrency trading knowledge. Subscribe, like, and hit the notification bell to stay updated with our latest content.
-
 14:23
14:23
Trading_Soldier
1 year agoTRADINGLITE HEATMAP TUTORIAL - How to Trade Crypto Using Heatmaps on TradingLite
163 -
 LIVE
LIVE
SpartakusLIVE
1 hour agoLIVE from the Creator House in FLORIDA || WZ Solos to Start - PUBG, REDSEC or ARC Later?!
439 watching -
 58:03
58:03
MattMorseTV
2 hours ago $29.43 earned🔴Trump is BRINGING the CHARGES. 🔴
36.7K74 -
 LIVE
LIVE
EricJohnPizzaArtist
4 days agoAwesome Sauce PIZZA ART LIVE Ep. #70: Movie Night featuring Dark Helmet!
273 watching -
 LIVE
LIVE
Joker Effect
1 hour agoMASSIVE UPDATES ON MY CHANNEL... what does 2026 look like? CHATTIN WITH WVAGABOND (The Captain).
362 watching -
 2:24:34
vivafrei
12 hours agoEp. 292: Bondi's Betrayal & Comey Judge Caught Lying! Crooks Acted Alone? Judicia Activism & MORE!
172K115 -
 LIVE
LIVE
GritsGG
6 hours ago#1 Most Warzone Wins 4015+!
812 watching -
 LIVE
LIVE
Due Dissidence
9 hours agoTrump SMITTEN By Mamdani, MTG RESIGNS, Hurwitz DOUBLES DOWN on CENSORSHIP, RFK Jr "Poetry" EXPOSED
1,186 watching -
 39:40
39:40
Tactical Advisor
6 hours agoUnboxing New Tactical Packs | Vault Room Live Stream 046
65.8K6 -
 3:30:58
elwolfpr
4 hours agoElWolfPRX Enters the Storm: First Winds
14.1K