Back To Reality! Watch Out For Gravity!
🟢 TRADE IDEAS & DISCORD: https://www.patreon.com/figuringoutmoney
🟢 TRADE WITH IBKR: http://bit.ly/3mIUUfC
🟢 BOOKMAP DISCOUNT (PROMO CODE "BM20" for 20% off the monthly plans): https://bookmap.com/members/aff/go/figuringoutmoney?i=79
__________________________________________________________________________________________
TIMESTAMPS: 00:00
Market Snapshot: 00:47
On Deck: 4:47
Intermarket Analysis: 06:37
S&P 500 Analysis: 09:51
Stock Market Indicators: 13:12
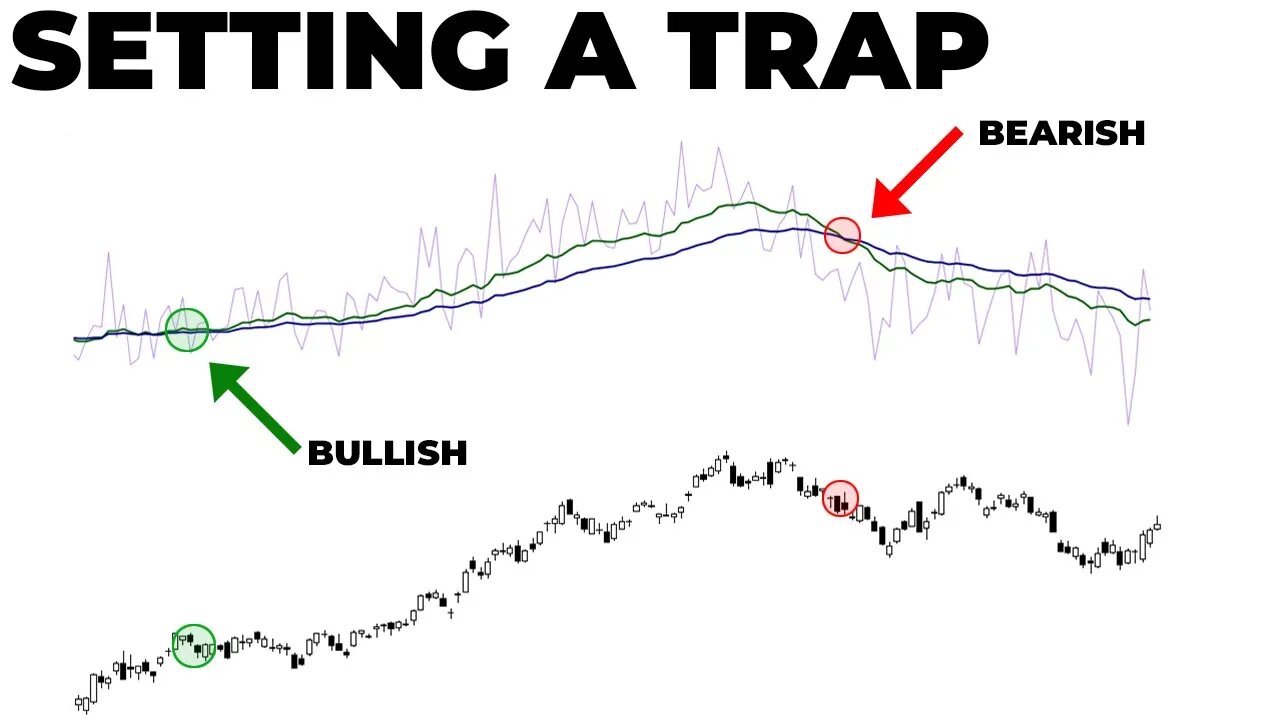
The video focuses on analyzing the current state of the financial markets, specifically the S&P 500, and various indicators that might suggest potential shifts in the market's direction. The host begins by noting recent positive movements in the market but raises the question of whether this rally is sustainable or if a reality check is imminent.
Throughout the video, the host delves into various market indicators and assets, such as the performance of small caps, the behavior of tech giants like Microsoft, Apple, and Google, and the significance of the five-day moving average. The video also touches on the importance of intermarket dynamics, highlighting the relationship between the 10-year yield and its impact on growth stocks. The host emphasizes the importance of being patient in the current market environment and discusses the potential volatility due to the negative gamma environment.
The video also covers macroeconomic data points that could influence the market, such as PPI, FOMC minutes, core inflation data, and Michigan consumer sentiment. Additionally, the host mentions upcoming earnings reports from major financial institutions and other significant companies. The video provides a detailed analysis of various stocks and sectors, pointing out patterns and potential setups for traders.
Towards the end, the host introduces the "Old Fool Indicator," a tool that tracks the NASDAQ composite's performance relative to the put-to-call ratio. This indicator, along with others discussed, provides insights into potential long-term trend changes in the market.
In summary, the video offers a comprehensive analysis of the current state of the financial markets, highlighting potential opportunities, risks, and key indicators that traders and investors should be aware of. The host emphasizes the importance of understanding the broader market context and being strategic in one's trading approach.
🔔 Subscribe now and never miss an update: https://www.youtube.com/c/figuringoutmoney?sub_confirmation=1
📧 For business inquiries or collaboration opportunities, please contact us at [email protected]
📈 Follow us on social media for more insights and updates:
🟢 Instagram: https://www.instagram.com/figuringoutmoney
🟢 Twitter: https://twitter.com/mikepsilva
______________________________________________________________________________________________
How To Predict How Far Stocks Can Go (EXPECTED MOVES):
○ https://youtu.be/JT32L89ZpEk
Saylor To Schiff Bitcoin Indicator:
○ https://youtu.be/zuG9Tjnud9k
Show Me The Money Scan:
○ https://youtu.be/dzRjEuUUb5g
Party Starter Scan:
○ https://youtu.be/zzaN91gcJOI
Bouncy Ball Scan:
○ https://youtu.be/7xKOo6vNaq8
Dark Money Scan:
○ https://youtu.be/ZUMuHaSg1ro
Sleepy Monster Scan:
○ https://youtu.be/C9EQkA7uVU8
High Volatility Scan:
○ https://youtu.be/VC327ko8DfE
______________________________________________________________________________________________
DISCLAIMER: I am not a professional investment advisor, nor do I claim to be. All my videos are for entertainment and educational purposes only. This is not trading advice. I am wrong all the time. Everything you watch on my channel is my opinion. Links included in this description might be affiliate links. If you purchase a product or service with the links that I provide I may receive a small commission. There is no additional charge to you! Thank you for supporting my channel :)
#Stockmarket #StockMarketAnalysis #DayTrading
-
 11:07
11:07
Figuring Out Money
2 years ago $0.01 earnedGet A Closer Look At This Stock Market Rally!
82 -
 1:16:43
BonginoReport
10 hours agoExposing Transgenderism w/ Amy Sousa - Nightly Scroll w/ Hayley Caronia (Ep.186)
118K22 -
 1:03:47
TheCrucible
4 hours agoThe Extravaganza! EP: 66 (11/25/25)
74.6K12 -
 1:58:47
Redacted News
5 hours ago"What I saw in Ukraine SHOOK me to my core" Ukraine is not a democracy, it never was | Redacted
116K66 -
 LIVE
LIVE
GritsGG
7 hours ago#1 Most Warzone Wins 4049+!
36 watching -
 LIVE
LIVE
MOONTV69
7 hours ago🔴LIVE - MARVEL RIVALS - GAMBIT LORD GRIND!! (PC)
39 watching -
![Final Fantasy Tactics The Ivalice Chronicles [1st Time Playing]](https://1a-1791.com/video/fww1/bc/s8/1/w/x/p/w/wxpwz.0kob.2-small-Gaming-with-Profitz-LIVE.jpg) LIVE
LIVE
ProfitzTV
4 hours agoFinal Fantasy Tactics The Ivalice Chronicles [1st Time Playing]
14 watching -
 7:24:37
Dr Disrespect
10 hours ago🔴LIVE - DR DISRESPECT - ARC RAIDERS - RANDOM SQUADS
149K12 -
 1:54:06
Russell Brand
7 hours agoHas he done it? Ukraine Accepts Core Peace Terms — Nobel Prize incoming? - SF655
134K19 -
 24:37
24:37
Stephen Gardner
6 hours agoTrump JUST Exposed 2 HUGE LIES meant to TAKE HIM DOWN!!
36.8K44