Head and Shoulders Chart Pattern | Technical Analysis in Urdu
Head and Shoulders Chart Pattern | Technical Analysis in Urdu
like share and sunscribe our channel for more videos on trading basic to advance
Head and Shoulders Chart Pattern Analysis in Hindi. Technical Analysis in Hindi
Three Buddhas Chart Pattern Analysis in Hindi. Technical Analysis in Hindi
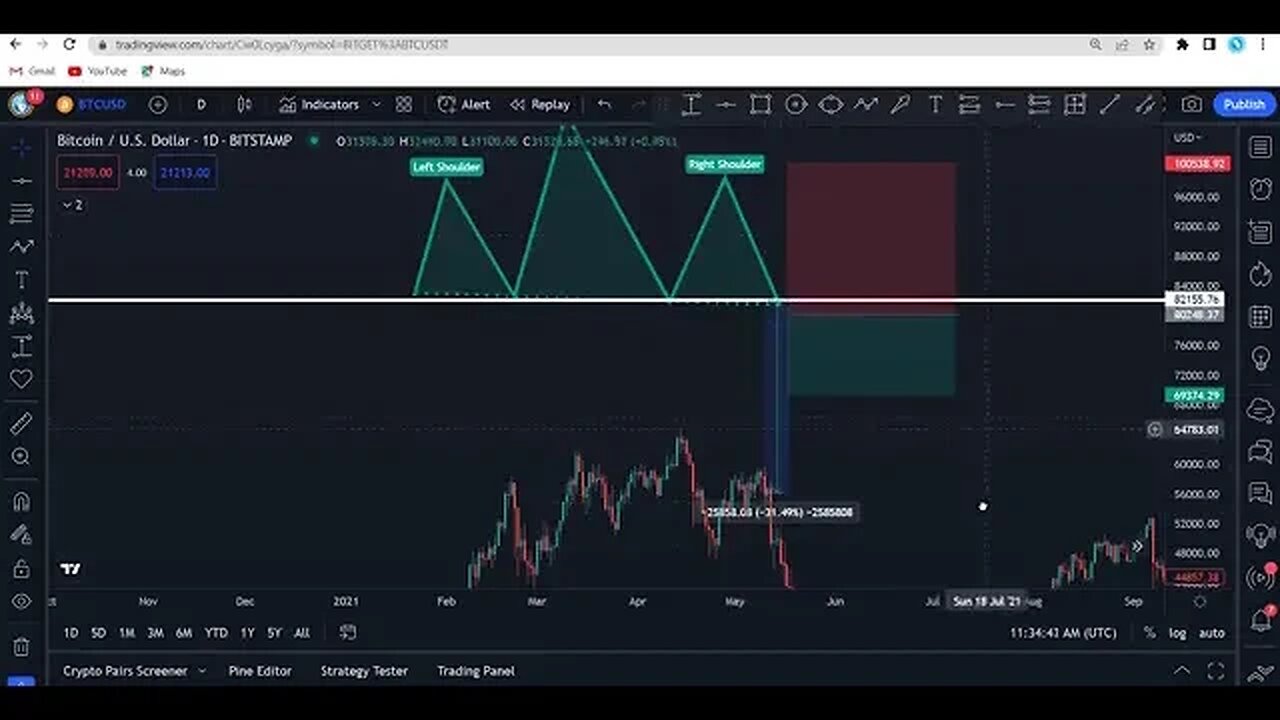
head and shoulders pattern is a chart formation that appears as a baseline with three peaks, the outside two are close in height and the middle is highest. In technical analysis, a head and shoulders pattern describes a specific chart formation that predicts a bullish-to-bearish trend reversal. The head and shoulders pattern is believed to be one of the most reliable trend reversal patterns. It is one of several top patterns that signal, with varying degrees of accuracy, that an upward trend is nearing its end Price Action #PriceAction
#HeadAndShoulder #HeadAndShoulders #ThreeBuddhas #ChartPattern Bearish reversal chart pattern Bullish reversal chart pattern
Through this channel you can successfully chart the analysis.
It can also determine when the trend will be established and the trend will be reversal.
Know the breakthrough time of breakout and break down.
And most importantly when do you have to buy and when to sell
You can answer the same with the help of Technical Analysis and Candlestick Charts Patterns.
Also, you can reduce profits in every type of market.
-
 LIVE
LIVE
LFA TV
21 hours agoLIVE & BREAKING NEWS! | WEDNESDAY 10/22/25
653 watching -
 1:03:22
BonginoReport
3 hours agoAmerican Political Violence Rages On - Nightly Scroll w/ Hayley Caronia (Ep.161)
79.8K34 -
 LIVE
LIVE
The Jimmy Dore Show
2 hours agoTrump’s MIDDLE FINGER to US Beef Ranchers! Dem Senate Candidate COVERS UP N@zi Tattoo! w/Twila Brase
8,071 watching -
 6:13
6:13
Sean Unpaved
1 hour agoKalshi's Pick of the Day: Who Could Be Florida's Next HC?
1.06K2 -

Dr Disrespect
8 hours ago🔴LIVE - DR DISRESPECT - BATTLEFIELD 6 KILL CHALLENGE - VS VISS
62.2K5 -
 16:16
16:16
Robbi On The Record
3 days ago $8.70 earnedThe Dark History of Halloween | What You Should Know
29.5K20 -
 LIVE
LIVE
Side Scrollers Podcast
3 days ago🔴FIRST EVER RUMBLE SUB-A-THON🔴DAY 3🔴PLAYING MIKE TYSON'S PUNCH OUT TILL I WIN!
1,309 watching -
 LIVE
LIVE
Quite Frankly
5 hours agoVatican Rumors, Demon Hunting, Spooky Extras | Leo Zagami 10/22/25
509 watching -
 LIVE
LIVE
The Mike Schwartz Show
2 hours agoTHE MIKE SCHWARTZ SHOW Evening Edition 10-22-2025
3,689 watching -
 1:27:14
Kim Iversen
4 hours agoCBS Boss Colluded With Israel to SPY on Americans | Trump Keeps Bombing Fisheman
45.8K83