Excel Tutorial: How to Perform Descriptive Statistics in Microsoft Excel
2 years ago
104
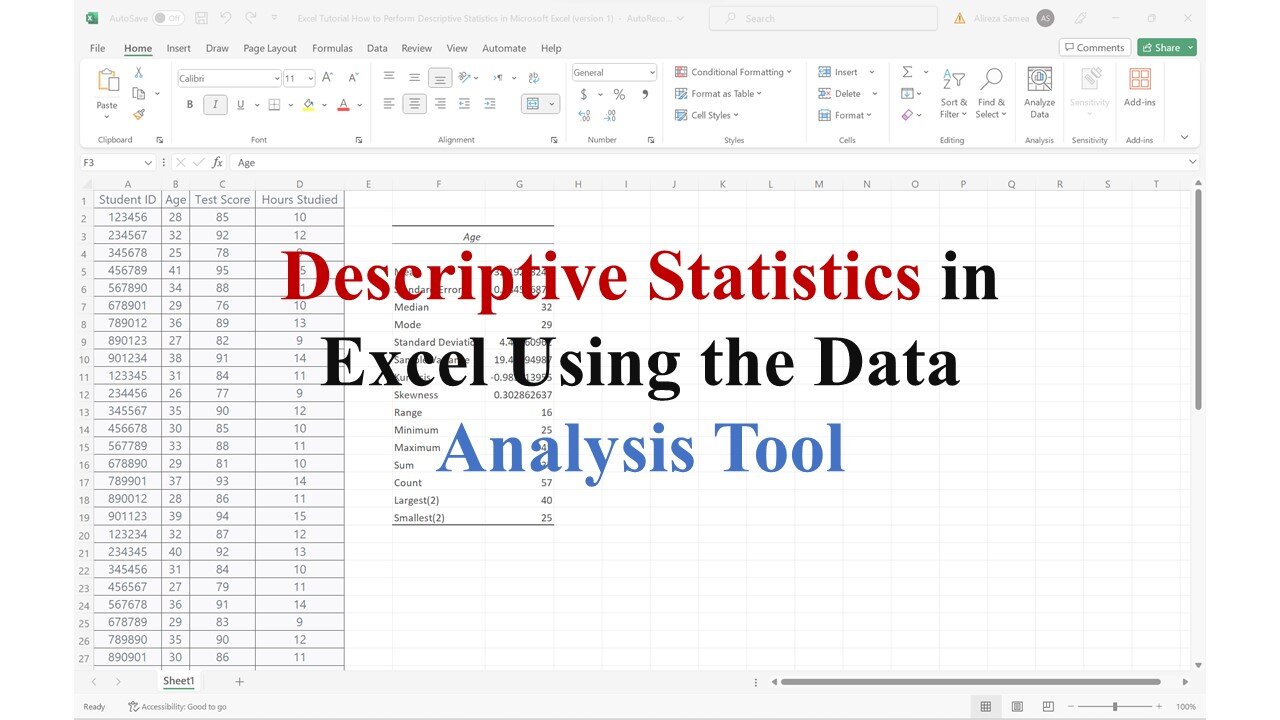
Welcome to "Excel Tutorial: How to Perform Descriptive Statistics in Microsoft Excel!" from Analytics Voyage📊🎉 This video tutorial is your go-to guide for nailing descriptive statistics in Microsoft Excel. We're breaking it down step by step so you can crunch numbers like a pro. We've got you covered from averages to spreads and everything in between. Let's turn those numbers into meaningful insights! 💡💪
Loading comments...
-
 11:32:19
Dr Disrespect
15 hours ago🔴LIVE - DR DISRESPECT - ARC RAIDERS - STELLA MONTIS QUESTS
242K18 -
 5:20:41
SpartakusLIVE
9 hours agoSolos on WZ to Start then ARC?! || Friends: UNBANNED
44.2K1 -
 12:58
12:58
Cash Jordan
9 hours agoMexican MOB OVERTHROWS Capital... as "Socialist President" FLOODS AMERICA with CARTELS
32.7K14 -
 23:13
23:13
Jasmin Laine
10 hours agoPBO Breaks His Silence—“This Is Soviet Stuff”… and the Panel EXPLODES
25.5K21 -
 1:17:26
Jamie Kennedy
23 hours agoCatching Up With Deep Roy: JKX Stories, Star Wars Secrets, and Total Chaos | Ep 231 HTBITY
19.3K3 -
 1:28:42
ThisIsDeLaCruz
5 hours ago $3.00 earnedThe Secrets Behind Madonna’s Legendary Live Sound
22.1K7 -
 1:22:15
Glenn Greenwald
9 hours agoTrump and JD Vance Weigh in on the MAGA Civil War Over Tucker; Zelensky's Top Associates Embroiled in $100 Million Corruption Scandal; FBI's Ongoing Concealment About Trump Shooter | SYSTEM UPDATE #548
126K110 -
 2:34:51
megimu32
5 hours agoON THE SUBJECT: 2000s Pop Punk & Emo Nostalgia — Why It Still Hits
22.6K6 -
 3:44:13
VapinGamers
6 hours ago $1.68 earnedBattlefield RedSec - Getting Carried Maybe? I Need the Wins! - !rumbot !music
15.2K3 -
 1:02:08
BonginoReport
9 hours agoThe Internet’s NSFW Reactions To “Bubba” Email - Nightly Scroll w/ Hayley Caronia (Ep.179)
76.7K62