Premium Only Content

TI SCAN IMPLANTS • TEMPERATURE • FREQUENCIES
Link:
https://www.tiktok.com/@lisa_ranel
• Excerpt from the Scan Report:
Graph 1
After intense review of all signals captured on the full spectrum analyzer during Lisa scan we found the following signals. They are shown in detail on the following graph.
The following graph shows the signal at 680 MHz. That we captured during the scan of Lisa on August 18 2023.
All signals shown are baseline and normal for the area except the signal shown in red. The red signal at 680 MHz with a magnitude 18 dBm is only present during the P/N junction scan of Lisa. This UHF (Ultra High Frequency) band is designated as a EU, NATO, and US L-band used for military telemetry and GPS.
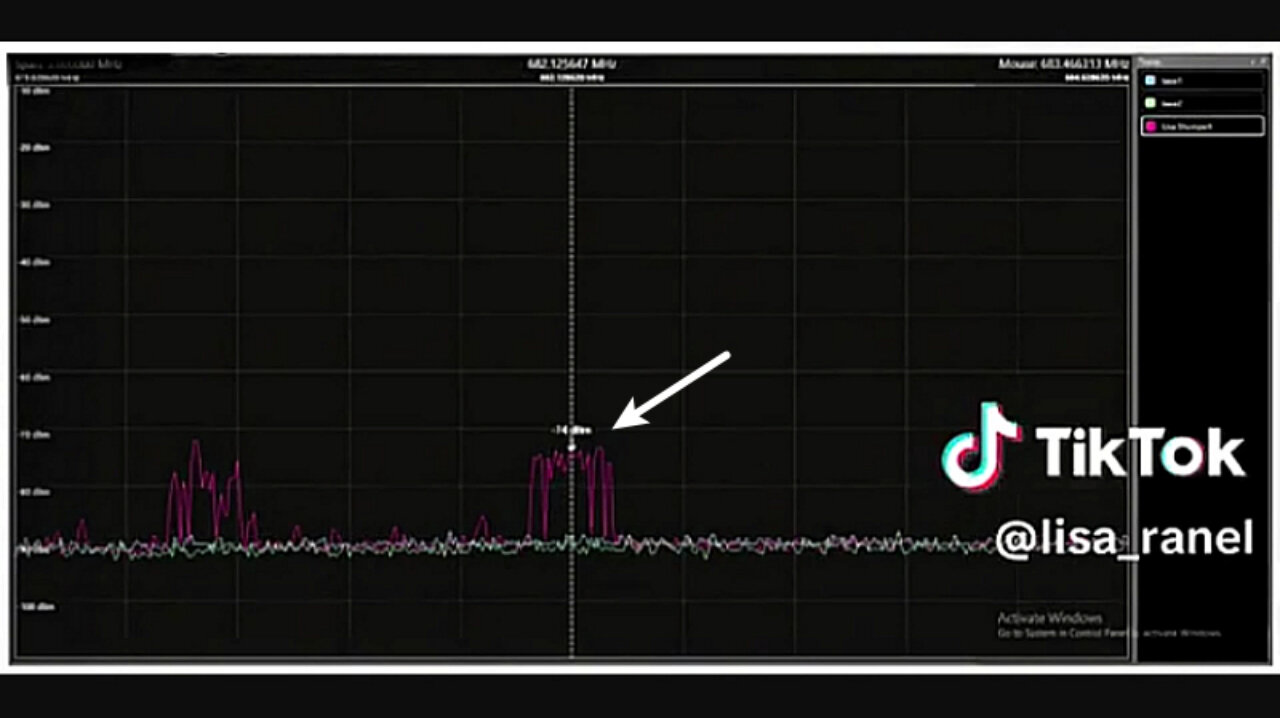
Graph 2
After intense review of all signals captured on the full spectrum analyzer during Lisa scan we found the following signals. They are shown in detail on the following graph.
The following graph shows the signal at 682 MHz. That we captured during the scan of Lisa on August 18 2023.
All signals shown are baseline and normal for the area except the signal shown in red. The red signal at 682 MHz with a magnitude 18 dBm is only present during the P/N junction scan of Lisa. This UHF (Ultra High Frequency) band is designated as a EU, NATO, and US L-band used for military telemetry and GPS.
Song: ANGELPLAYA - PULL UP [NCS Release]
Music provided by NoCopyrightSounds
Free Download/Stream: http://ncs.io/PULLUP Watch: http://youtu.be/
-
 LIVE
LIVE
Futures Edge: Finance Unfiltered with Jim Iuorio and Bob Iaccino
59 minutes agoLIVE Global Macro & The Lie About Tariffs
220 watching -
 LIVE
LIVE
LFA TV
19 hours agoLFA TV ALL DAY STREAM - TUESDAY 7/8/25
1,649 watching -
 1:20:06
Awaken With JP
4 hours agoThere's No List, & You Should Just Shut Up - LIES Ep 99
33.2K66 -
 39:39
39:39
Michael Franzese
2 hours agoIs Alligator Alcatraz Really That Bad? My Honest Take
22.6K10 -
 LIVE
LIVE
The HotSeat
1 hour agoYou Can’t Flashy-Thing Us! The Epstein Cover-Up STINKS — And the FBI’s the Real Criminal Empire!
1,024 watching -
 22:58
22:58
Clownfish TV
10 hours agoSuperman WILL Be Political, Says James Gunn.
4.68K6 -
 47:19
47:19
The Finance Hub
6 hours ago $0.58 earnedYou Won't BELIEVE What JUST Happened To Elon Musk!
3.91K15 -
 1:41:41
The Quartering
3 hours agoEpstein Coverup Gets Worse, Superman Is Super Woke & Brett Cooper Replacement Savaged!
98.6K53 -
 1:44:23
Russell Brand
5 hours agoTHE MISSING MINUTE! Epstein Footage Missing AT LEAST A Minute + Cell Door Questions - SF610
157K34 -
 57:27
57:27
Sean Unpaved
4 hours agoMidseason Mindset, Texas Heroes, & the Hype Surrounding EA's New CFB 26
34.5K2