NASA’s New Scientific Breakdown of Dramatic Caldor and Dixie Fires
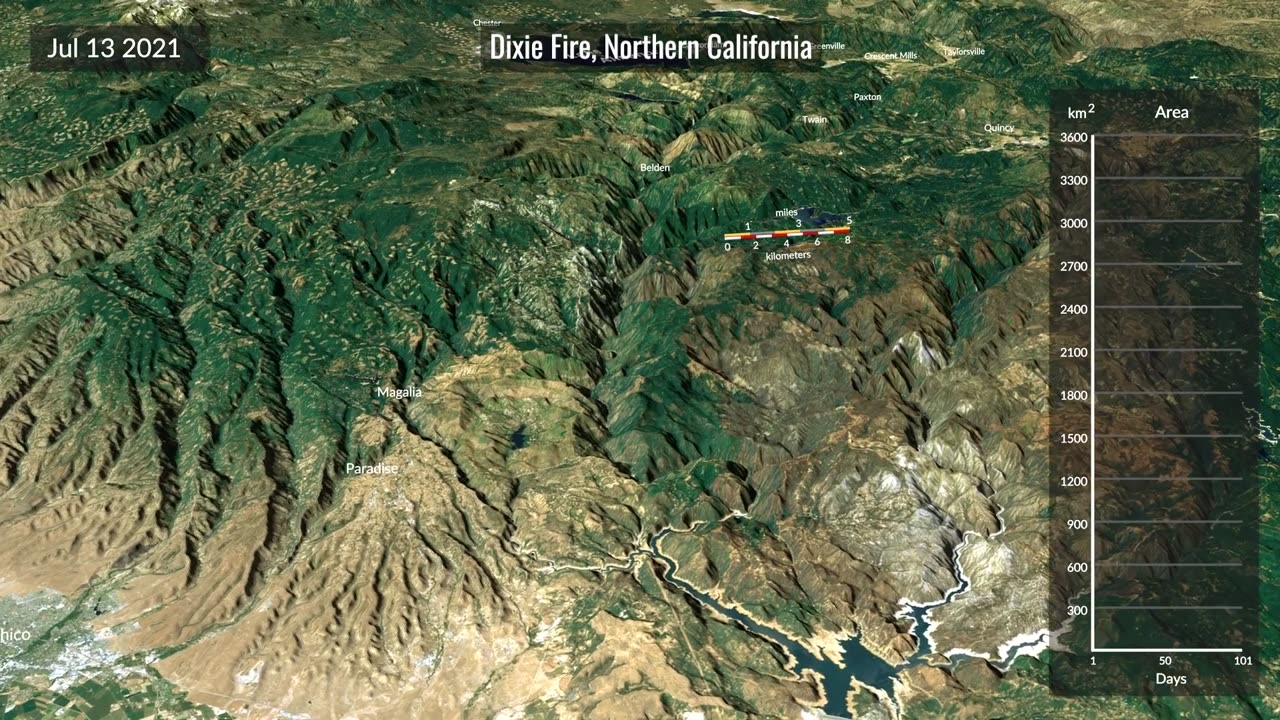
This visualization shows the spread of the Caldor fire between August 15 and October 6, 2021, and the Dixie fire between July 14 and October 22, 2021, updated every 12 hours from a new fire detection and tracking approach based on near-real time active fire detections from the VIIRS sensor on the Suomi-NPP satellite. The yellow outlines track the position of the active fire lines for the last 60 hours, with the latest location of the fire front in the brightest shade of yellow. The red points show the location of active fire detections, while the grey region shows the estimated total area burned. The graph shows the cumulative burned area in square kilometers. Editor's Note: The spelling of Eldorado National Forest appears incorrectly in the visualization. Music credit: “Color Chart” and “Abstract Dimensions” from Universal Production Music Credit: NASA's Goddard Space Flight Center Kathleen Gaeta (GSFC AIMMS): Lead Producer Cindy Starr (GST): Lead Animator Doug Morton (NASA GSFC): Lead Scientist This video is public domain and along with other supporting visualizations can be downloaded from NASA Goddard's Scientific Visualization Studio at:
-
![Devin Nunes - Devin Nunes Reveals The Document The [DS] Was Looking For Was Hidden,Truth Is Coming](https://1a-1791.com/video/fww1/20/s8/1/-/e/L/d/-eLdz.0kob-small-Devin-Nunes-Devin-Nunes-Rev.jpg) 1:17:44
1:17:44
X22 Report
6 hours agoDevin Nunes - Devin Nunes Reveals The Document The [DS] Was Looking For Was Hidden,Truth Is Coming
99K73 -
 LIVE
LIVE
GritsGG
7 hours agoRumble Customs! 3515 Ws! 🫡!
202 watching -
 LIVE
LIVE
CassaiyanGaming
3 hours agoWARZONE PALOOZA - Rebirth with Cassaiyan, HannibalLecter, and DudeBroDude
34 watching -
 4:13:38
Akademiks
5 hours agoWar in RAT-LANTA. Young Thug vs Gunna vs Ralo vs YSL MONDO. Who Will Le Bebe Pick. FINAL CRASHOUT!
137K4 -
 21:55
21:55
MYLUNCHBREAK CHANNEL PAGE
1 day agoFault Lines are GATES - Pt 3
20.8K6 -

Sgt Wilky Plays
3 hours agoRumble Gaming Bad Company Presents WARZONEPALOOZA
15.3K -
 17:54
17:54
Nate The Lawyer
6 hours ago $1.88 earnedChicago Mayor’s $600M Migrant Spending Leaves City $1.1B Budget CRISIS.
19.8K26 -
 LIVE
LIVE
cosmicvandenim
16 hours agoVAN DENIM x RALLIED & GRITS | Team 6: Denim Grit | Warzonepalooza Tournament
209 watching -
 LIVE
LIVE
GamerGril
3 hours ago💕 The Evil Within 2 💕 | First Time Playthrough | Backseat Gaming Encouraged
68 watching -
 1:03:57
Jeff Ahern
4 hours ago $2.80 earnedThe Saturday show with Jeff Ahern
17.3K6