NASA’s New Scientific Breakdown of Dramatic Caldor and Dixie Fires
1 year ago
1
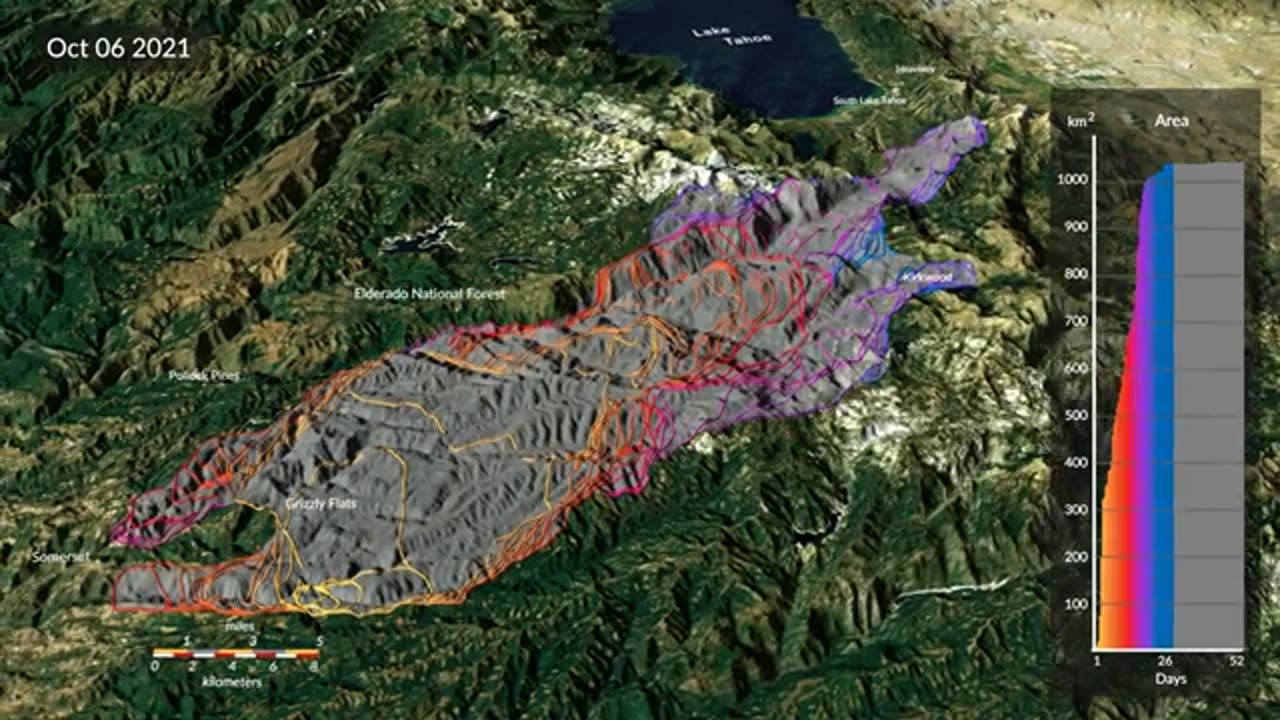
This visualization shows the spread of the Caldor fire between August 15 and October 6, 2021, and the Dixie fire between July 14 and October 22, 2021, updated every 12 hours from a new fire detection and tracking approach based on near-real time active fire detections from the VIIRS sensor on the Suomi-NPP satellite. The yellow outlines track the position of the active fire lines for the last 60 hours, with the latest location of the fire front in the brightest shade of yellow. The red points show the location of active fire detections, while the grey region shows the estimated total area burned. The graph shows the cumulative burned area in square kilometers.
Loading comments...
-
 DVR
DVR
Flyover Conservatives
22 hours ago9/11 on Steroids: What’s Coming This Fall? - Bo Polny | FOC Show
16.5K1 -
 1:01:28
Precision Rifle Network
8 hours agoS4E27 Guns & Grub - Let's Talk About Gas Guns
5.65K1 -
 59:29
59:29
The Charlie Kirk Show
3 hours agoTHOUGHTCRIME Ep. 96 — The Great Flag Burning Debate
42.1K30 -
 57:56
57:56
The Mel K Show
3 hours agoMel K & General Mike Flynn | Betrayal of a Nation: Soros’ NATO World Order | 8-28-25
26.3K23 -
 2:13:31
Joker Effect
2 hours agoInterviewing BEN JAMMINS! A personality with over 1 BILLION gif views. Let's give him a warm welcome
13.2K -
 11:37
11:37
Robbi On The Record
9 hours agoThe Devil is in the Branding..
14.5K8 -
 1:26:44
Savanah Hernandez
4 hours agoWhy Gen-Z Is So Radicalized Against Immigration
10.8K5 -
 2:36:19
megimu32
4 hours agoOTS: From A-List to MIA! 90s & 2000s Stars Who Vanished
8.85K3 -
 LIVE
LIVE
TinyPandaface
3 hours agoYour FACE Is A Gaming Channel! | Super Smash Bros w/ THE FELLAS!
41 watching -
 LIVE
LIVE
Flex011
5 hours ago $0.07 earnedMETAL GEAR SOLID : SNAKE EATER
22 watching