NASA Tracks Freddy, Longest-lived Tropical Cyclone on Record
longest-lived tropical cyclone in recorded history, Freddy set the record for having the highest accumulated cyclone energy (ACE) of any storm in history. ACE is an index used to measure the total amount of wind energy associated with a tropical cyclone over its lifetime.
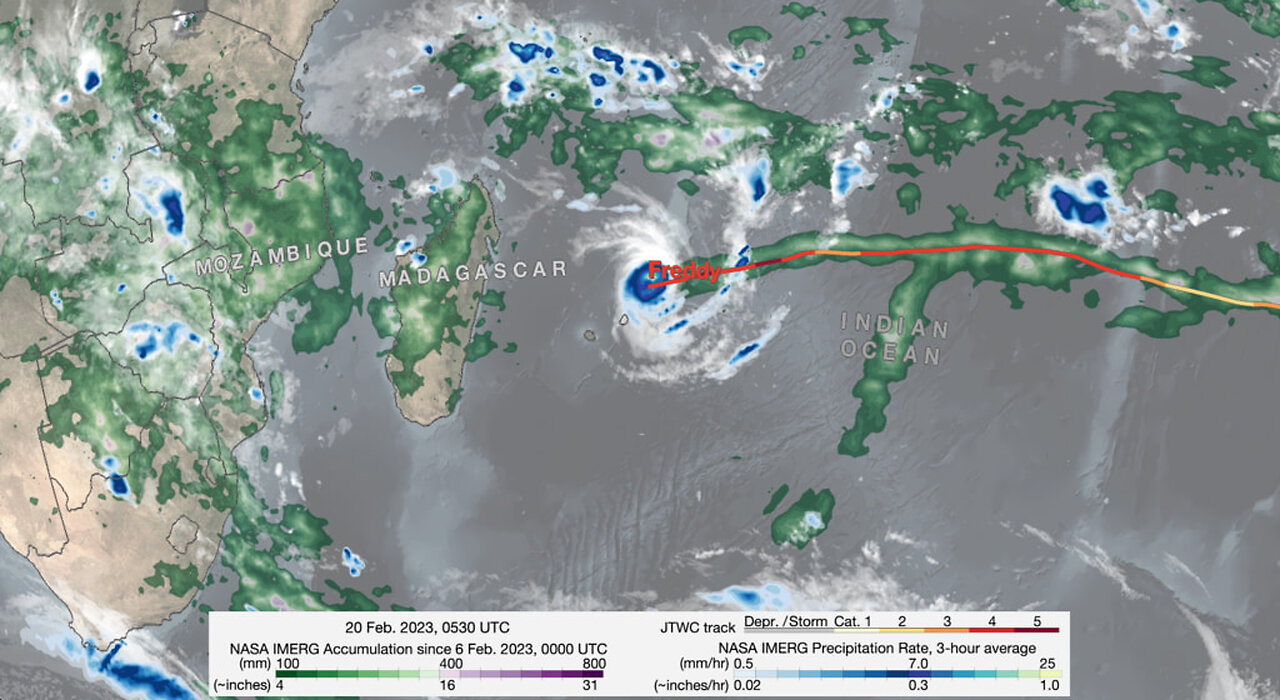
NASA’s IMERG satellite precipitation product is ideal for monitoring and studying tropical cyclones around the world, especially over the open ocean where ground-based observations are sparse. IMERG uses precipitation estimates from a constellation of satellites united by the GPM Core Observatory to generate maps of global precipitation updated every 30 minutes in near real-time. The above animation shows IMERG surface rainfall estimates associated with the passage of Tropical Cyclone Freddy across the Indian Ocean as well as Freddy’s corresponding track and intensity. The animation begins at on Feb. 6, 2023, just before Freddy is about to form northwest of Australia. Over the course of the storm’s history, IMERG reveals a variety of precipitation features and trends that relate closely to the variations in Freddy’s intensity.
Tropical cyclones derive their energy from latent heating, which comes primarily from cloud condensation. Although essentially undetectable directly, the most significant latent heat release occurs within deep convective towers, which are associated with high cold cloud tops and areas of heavy rain at the surface. The IMERG animation illustrates this association between increased surface rain intensity and storm intensity - whenever Freddy undergoes a period of intensification, it is preceded by an increase in heavy rain. However, for the storm to really respond to the latent heating, that heating must occur near the storm’s center. For example, IMERG shows heavier rain on Feb. 8, but it is too far north of the center, and Freddy continues to weaken. Conversely, an absence of heavy rain near the center typically causes the storm to weaken. IMERG is also able to broadly resolve Freddy’s structure over the course of its lifetime, ranging from a highly asymmetrical rain field with most of the rain located on one side of the center, which occurs when the storm is weak or undergoing wind shear, to symmetrical when the storm is stronger, to having a full eye when the storm has an intense and well-developed circulation.
The end of the animation shows the total estimated rainfall for the entire period. IMERG shows that although heavy rain near the core of the storm is key to the storm maintaining or increasing in intensity, the highest overall rainfall totals are much more closely correlated to slow storm speed as evidenced by the extreme rainfall totals over Mozambique despite Freddy having weakened to a tropical storm. Here Freddy essentially stalls out for several days (Feb. 24 to March 2), allowing a sizeable portion of the storm’s circulation to remain over the warm waters of the Mozambique Channel and rainbands to continuously form and move inland. The result is rainfall totals on the order of ~16 to 31 inches (~400 to 800 mm, shown in purple) over parts of southern Mozambique and along the coast. Peak rainfall totals over Madagascar, where Freddy moved steadily across the island, are on the order of ~16 inches (400 mm). According to the latest media reports Freddy has been responsible for over 300 deaths in Mozambique, Madagascar and Malawi, and has caused widespread damage throughout these regions.
-
 5:30:52
SpartakusLIVE
9 hours agoDuos w/ @GloryJean || #1 Masculine Muscle MASS sears YOUR retinas with MIND BENDING content
219K3 -
 3:05:49
TimcastIRL
8 hours agoNew DOCS PROVE Obama Hillary CONSPIRACY To SABOTAGE Trump Admin | Timcast IRL
217K101 -
 2:29:36
Laura Loomer
8 hours agoEP136: YOU'RE FIRED! White House Vetting Crisis Continues
58.8K39 -
 8:07
8:07
MattMorseTV
8 hours ago $6.31 earnedTrump just LOWERED PRICES by 75 PERCENT.
35.6K37 -
 LIVE
LIVE
Misfit Electronic Gaming
11 hours ago $4.37 earned"LIVE" "Blind Descent' +"Dollhouse of Dead" Playtest 10 Followers till we hit 1000! We CAN do this!
512 watching -
 21:53
21:53
Glenn Greenwald
10 hours agoMichael Tracey on the Street: What Do People Think of the Epstein Case?
127K58 -
 2:26:28
megimu32
7 hours agoOTS: Board Games Gone Wild! The Loud, Weird & Chaotic Games That Raised Us
37.6K9 -
 4:25:16
DamnDanieI
8 hours agoKill First, Loot Later – OTG Live
55.3K1 -
 56:41
56:41
Donald Trump Jr.
12 hours agoLies, Leaks, and Lawfare: Censorship Corruption Exposed | TRIGGERED Ep.263
180K162 -
 1:19:46
Precision Rifle Network
9 hours agoS4E25 Guns & Grub - Rex Is Back, I shot the 6.5PRC finally...
33.9K1