Candlestick Patterns in Crypto Trading: Understanding and Interpreting Price Movements
Crypto Pattern Clarification
Default (GPT-3.5)
User
Candelistic crypto pattern description
ChatGPT
The term "Candelistic crypto pattern" doesn't appear to be widely recognized in the field of cryptocurrencies or technical analysis. Could you please provide more context or details about what you're referring to? This will help me provide you with a more accurate response.
User
Give me the discription for
Candelistic crypto pattern description
ChatGPT
I apologize, but as of my last knowledge update in September 2021, I am not familiar with the term "Candelistic crypto pattern." It's possible that this term has emerged after my last update or might be a specific term used by a particular group or platform. If you can provide more context or details about what this pattern entails, I would be happy to try to help based on the information available up to September 2021.
User
Candlestick
ChatGPT
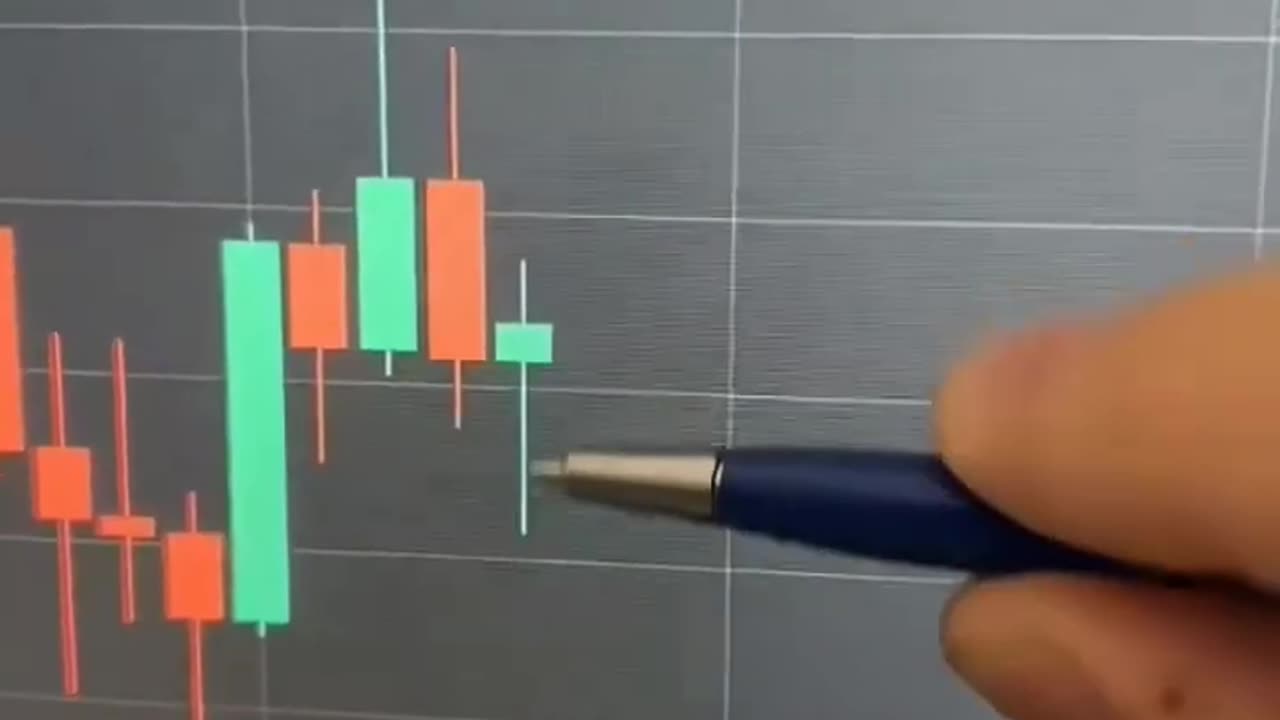
Candlestick patterns are widely used in technical analysis to interpret price movements of financial assets, including cryptocurrencies. They are formed by the open, high, low, and close prices of an asset within a specific time period. Some common candlestick patterns include:
Doji: Represents indecision in the market. The open and close prices are nearly the same, forming a cross-like shape.
Hammer and Hanging Man: These patterns have a small body and a long lower wick. A hammer indicates potential bullish reversal, while a hanging man can suggest a bearish reversal.
Engulfing Patterns: A bullish engulfing pattern occurs when a small bearish candle is followed by a larger bullish candle. A bearish engulfing pattern is the opposite.
Morning Star and Evening Star: Morning star is a bullish reversal pattern, consisting of a downtrend followed by a small candle and then a large bullish candle. Evening star is the bearish counterpart.
Three White Soldiers and Three Black Crows: Three white soldiers is a bullish pattern with three consecutive long bullish candles, indicating strong buying. Three black crows is a bearish pattern with three consecutive long bearish candles, suggesting strong selling.
Bullish and Bearish Harami: The bullish harami occurs when a small bearish candle is followed by a larger bullish candle. The bearish harami is the opposite.
-
 LIVE
LIVE
The Jimmy Dore Show
3 hours agoTrump Administration Sends Accused Pedo BACK TO ISRAEL! Ukrainians Now OVERWHELMINGLY Oppose War!
8,430 watching -
 6:44:51
Dr Disrespect
9 hours ago🔴LIVE - DR DISRESPECT - IMPOSSIBLE 5 CHICKEN DINNER CHALLENGE - FEAT. VISS
103K15 -
 LIVE
LIVE
GloryJean
1 hour agoDominating The Sniper Role 🖱️ 6.7 K/D | Duos w/ Spartakus
18 watching -
 LIVE
LIVE
BigTallRedneck
1 hour agoBRRRAP PACK VS ANYBODY!!
30 watching -
 1:09:21
TheCrucible
4 hours agoThe Extravaganza! Ep. 24 (8/20/25)
65.8K10 -
 1:18:42
Kim Iversen
4 hours agoUFO Base Area 51 Catches Fire… Is It a Massive Cover-Up?!
39.7K59 -
 1:51:18
Redacted News
5 hours ago"There will be consequences!!!" Trump issues big threat to Putin ahead of peace summit | Redacted
111K105 -
 53:14
53:14
Candace Show Podcast
5 hours agoThe MOST MORAL Blackmail In The World | Candace EP 231
64.5K148 -
 1:11:28
vivafrei
6 hours agoMatt Taibbi Getting "Westfalled"? Kathy Hochul Fighting for Illegals! Mamdani Minority Report & MORE
108K59 -
 2:03:39
Pop Culture Crisis
6 hours agoWTF Happened to Miley Cyrus? HARRY POTTER Set Images, Sydney Sweeney Hater EXPOSED | Ep. 901
49.5K22