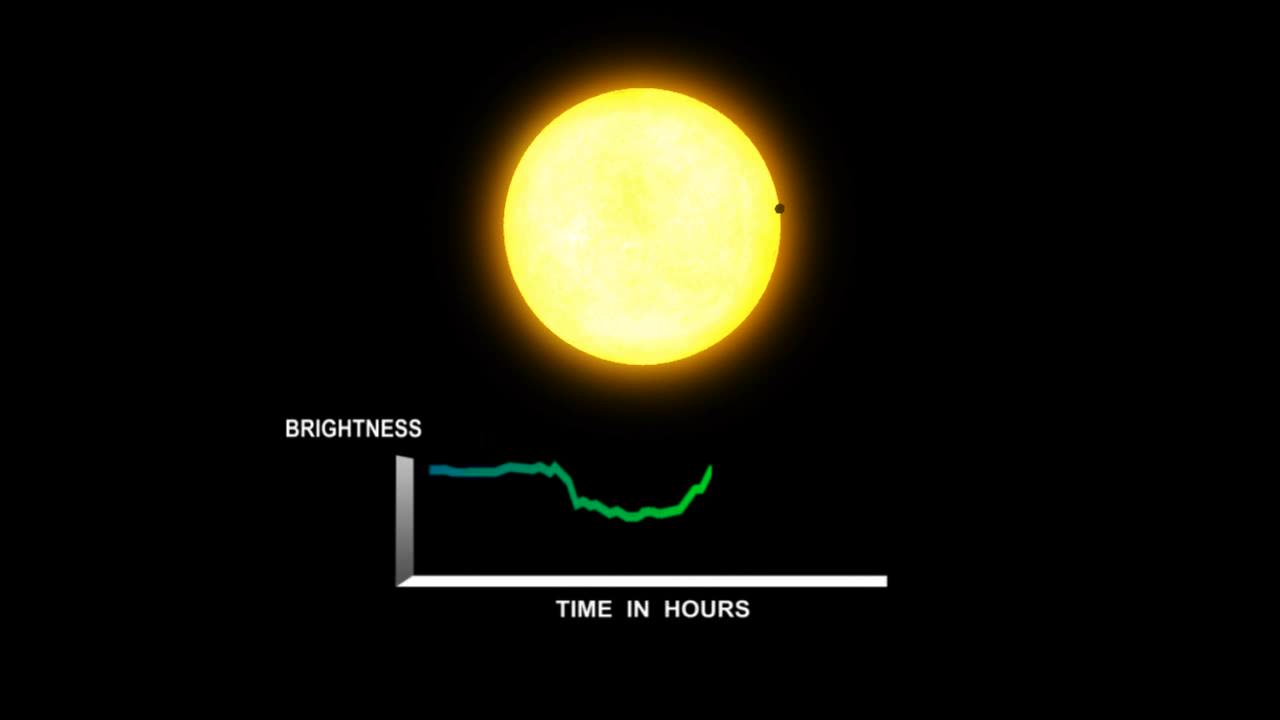
Transit Graph: Mapping Time and Brightness| 4K
2 years ago
5
Explore the dynamic relationship between time and brightness through the captivating visual of a transit graph. Witness the ebb and flow of data as it charts the changing luminance over time, revealing patterns and insights. Immerse yourself in the dance of light and shadow that paints a vivid picture of celestial phenomena.
Loading comments...
-
 4:19
4:19
PistonPop-TV
6 days ago $0.90 earnedThe 4E-FTE: Toyota’s Smallest Turbo Monster
3.08K -
 43:07
43:07
WanderingWithWine
5 days ago $0.66 earned5 Dreamy Italian Houses You Can Own Now! Homes for Sale in Italy
3.68K2 -
 LIVE
LIVE
Spartan
20 hours agoFirst playthrough of First Berserker Khazan
281 watching -
 28:01
28:01
Living Your Wellness Life
2 days agoTrain Your Hormones
6.54K -
 43:28
43:28
The Heidi St. John Podcast
1 day agoFan Mail Friday: Faith Over Fear and Finding Strength in Every Season
3.46K -
 1:05:30
SGT Report
1 day agoTHE HORRIBLE TRUTH ABOUT EVERYTHING -- Harley Schlanger
45.2K87 -
 11:04
11:04
Blackstone Griddles
16 hours agoCountry Fried Steaks on the Blackstone Griddle
90.2K14 -
 49:47
49:47
Brad Owen Poker
1 day agoI Get My First BIIGGG Win! $25,000+ Buy-in! HORSE Championship! Don’t Miss! Poker Vlog Ep 324
15K1 -
 9:53
9:53
Rethinking the Dollar
1 day agoWhen Detroit Bleeds, America Suffer! Layoffs Have Begun
19.2K31 -
 18:36
18:36
Clownfish TV
1 day agoYouTube Just NERFED YouTube Gaming... | Clownfish TV
21.9K32