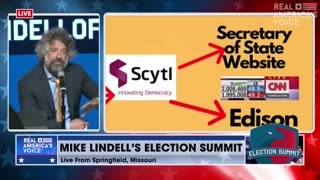
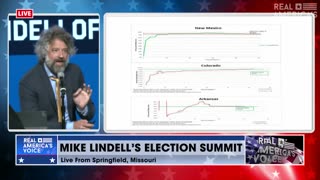
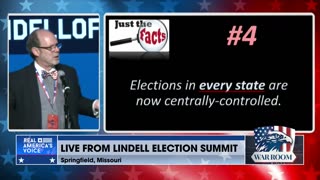
Professor David K. Clements Explains ‘F’ Curve Seen During Election Night 2020
Enjoyed this video? Join my Locals community for exclusive content at
ravsocial.locals.com!
11 months ago
2.64K
Professor David K. Clements explains how all the swing states in 2020 saw the same giant ‘F’ curve spikes during election night.
Watch our LIVE coverage of @realMikeLindell’s Election Summit here: https://rumble.com/v38hk4o-special-live-from-mike-lindells-plan-revealed-stage-speakers-8-17-23.html
Loading comments...
-
 2:50
2:50
RealAmericasVoice
11 months agoProfessor David K. Clements Explains Election Night Reporting
2.02K -
 4:58
4:58
RealAmericasVoice
11 months agoProfessor David K. Clements Talks About Inexplicable Vote Ratios
5.66K1 -
 0:48
0:48
WTMJMilwaukee
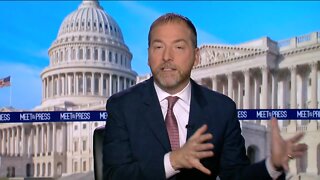
2 years agoChuck Todd: Trends in battleground states following Spring Election
6 -
 50:44
50:44
NeptuneMike
1 year agoL3 - Analysis of Midterm 2022 Election - Nov13_2022
8 -
 7:58
7:58
Bannons War Room
11 months agoDr. Frank Explains Indicators Giving Away Democrats' Election Steal | Election Crime Bureau Summit
20.4K16 -
 17:39
17:39
The Eric Metaxas Radio Show
1 year agoMichele Bachmann of Regent University Provides Insights into Yesterday's Election Results
6.56K15 -
 6:19
6:19
Tony Perkins
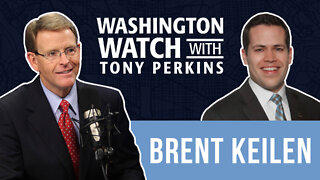
2 years ago $0.01 earnedBrent Keilen Analyzes the Most Recent Midterm Primary Election Results
22 -
 4:27
4:27
WXYZ
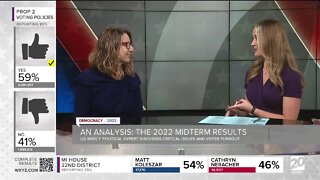
1 year agoAnalyzing the 2022 Midterm Elections
180 -
 1:08
1:08
KERO
3 years ago23ABC political analysts discuss the Electoral College
48 -
 3:01
3:01
KTNV
3 years agoUNLV Assistant Professor analyzes Presidential Race
13