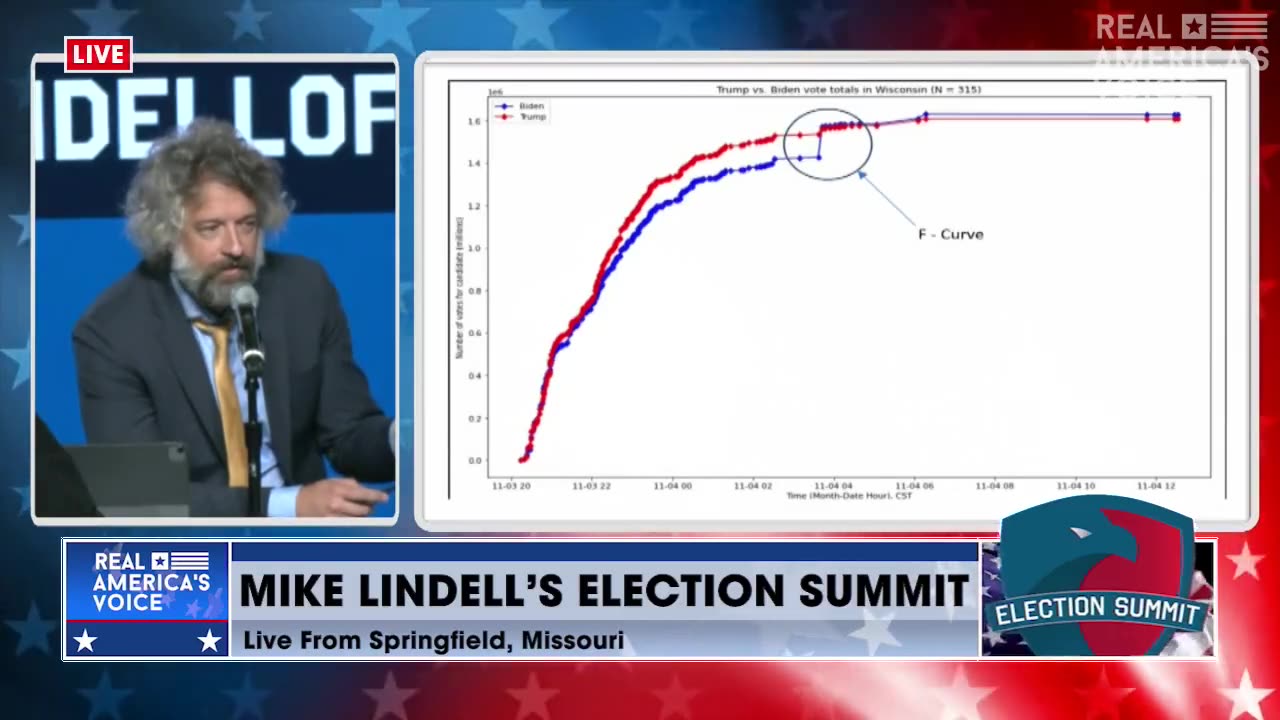
Professor David K. Clements Explains ‘F’ Curve Seen During Election Night 2020
1 year ago
2.84K
Professor David K. Clements explains how all the swing states in 2020 saw the same giant ‘F’ curve spikes during election night.
Watch our LIVE coverage of @realMikeLindell’s Election Summit here: https://rumble.com/v38hk4o-special-live-from-mike-lindells-plan-revealed-stage-speakers-8-17-23.html
Loading comments...
-
 LIVE
LIVE
I_Came_With_Fire_Podcast
8 hours agoTRUMP WANTS TO KILL TRANS KIDS | CHINA IN TROUBLE | NYC IS RETARDED | WHO WILL WIN THE MIDTERMS
1,398 watching -
 2:05:52
TimcastIRL
3 hours agoTrump Russia HOAX DECLASSIFIED, Obama Officials EXPOSED In “TREASONOUS CONSPIRACY”
120K96 -
 2:58:12
SavageJayGatsby
3 hours agoLockdown Protocol - Wedding in 3 Months! - Halftway to 100!
21.1K1 -
 2:41:27
Mally_Mouse
6 hours agoFriend Friday!! - Let's Play! - Lockdown Protocol
19.2K4 -
 9:43
9:43
MattMorseTV
6 hours ago $3.58 earnedTulsi just DROPPED a BOMBSHELL.
22.2K39 -
 LIVE
LIVE
SynthTrax & DJ Cheezus Livestreams
15 hours agoFriday Night Synthwave 80s 90s Electronica and more DJ MIX Livestream Knight Ride Edition
216 watching -
 2:31:18
Laura Loomer
6 hours agoEP134: EXPOSED: Microsoft Allowed China Access To DOD Cyber Systems
149K73 -
 2:46:43
FusedAegisTV
7 hours agoRumble Smackdown! #004 Tekken 8 $100+ Online Tournament !bracket !prizepool
27.5K -
 1:53:41
The Mike Schwartz Show
11 hours agoTHE MIKE SCHWARTZ SHOW Evening Edition 07-18-2025 with guest Congressman Buddy Carter!
34.8K39 -
 LIVE
LIVE
DopeFrags
9 hours agoOne of the best survival games ever? | Grounded
25 watching