Transit Graph
1 year ago
6
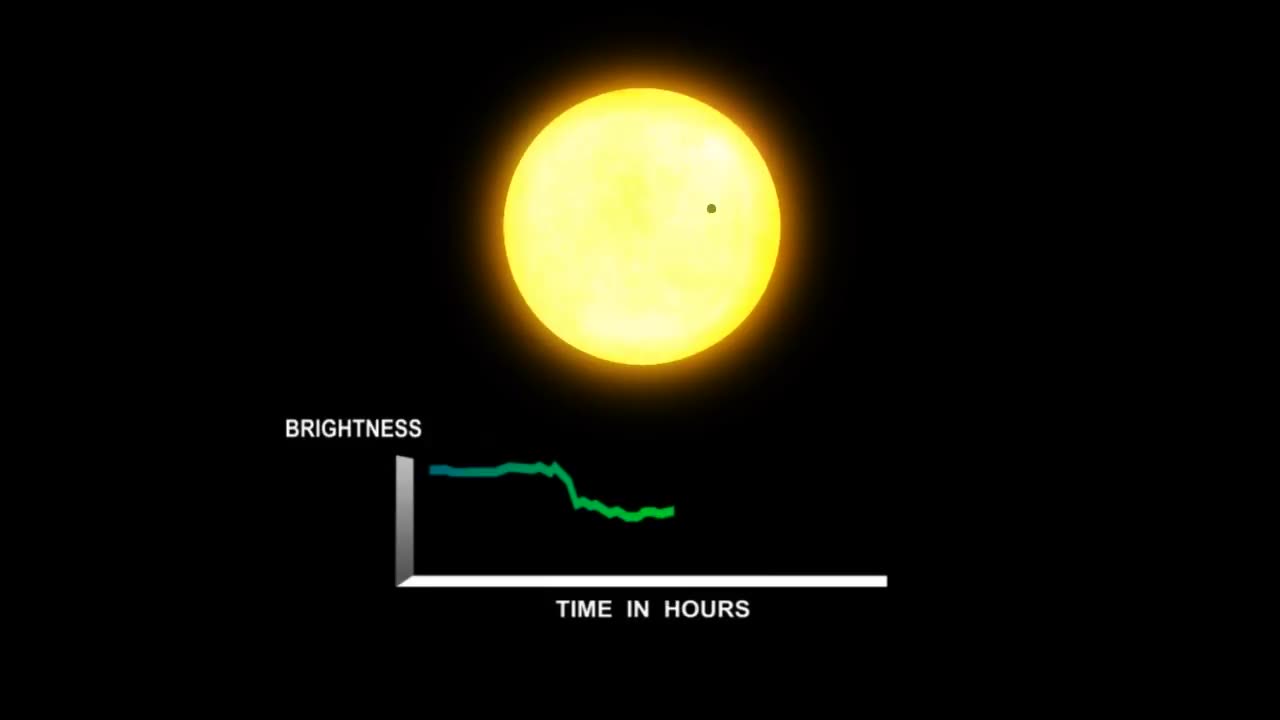
Kepler measures the brightness of stars. The data will look like an EKG showing the heart beat. Whenever a planet passes in front of its parent star as viewed from the spacecraft, a tiny pulse or beat is produced. From the repeated beats we can detect and verify the existence of Earth-size planets and learn about the orbit and size of the planet. The scientific data from Kepler come in a different way than most astronomy missions. The Kepler spacecraft will not produce pretty pictures or even colorful spectrograms, but rather light curves derived from brightness changes collected from transits. Credit: NASA Ames and Dana Berry
Loading comments...
-
 LIVE
LIVE
Redacted News
1 hour agoBOMBSHELL EPSTEIN SH*T SHOW JUST DROPPED ON WASHINGTON, WHAT IS THIS? | Redacted w Clayton Morris
16,503 watching -
 LIVE
LIVE
Revenge of the Cis
3 hours agoEpisode 1453: Fat & Fit
1,863 watching -
 2:38:12
The White House
4 hours agoPresident Trump Holds a Press Conference with Prime Minister Keir Starmer of the United Kingdom
34.5K16 -
 1:01:04
In The Litter Box w/ Jewels & Catturd
22 hours agoDrain the Swamp! | In the Litter Box w/ Jewels & Catturd – Ep. 751 – 2/27/2025
32.5K23 -
 1:11:24
Dr. Drew
4 hours agoNEW: Cardiac Arrest In Healthy Young People After mRNA w/ Nicolas Hulscher – Ask Dr. Drew
16.5K14 -
 4:24:53
Right Side Broadcasting Network
8 hours agoLIVE REPLAY: President Trump and UK Prime Minister Starmer Meet and Hold a Press Conference 2/27/25
108K42 -
 2:12:33
Adam Carolla
2 days agoKamala Harris vs. Trump Wildfire Response + Jillian Michaels on Motherhood/Ayahuasca & Sperm Donors!
17.4K11 -

Barry Cunningham
7 hours agoTRUMP DAILY BRIEFING: PRESIDENT TRUMP AND UK PRIME MINISTER STARMER HOLD PRESS CONFERENCE!
33.6K11 -
 1:44:47
The Quartering
4 hours agoEpstein Files RELEASED Today, Gene Hackman Mystery & Trump Vs Woke Reporters!
67.1K26 -
 1:19:38
Ben Shapiro
5 hours agoEp. 2147 - HUGE: The Washington Post SURRENDERS…To Reality!
76.6K16