How to make XY scatter plot in Excel
Hello, My Dear Friends, !! In this video, I will show you How to make an XY scatter plot in Excel. Watch the video till the end Thanks.
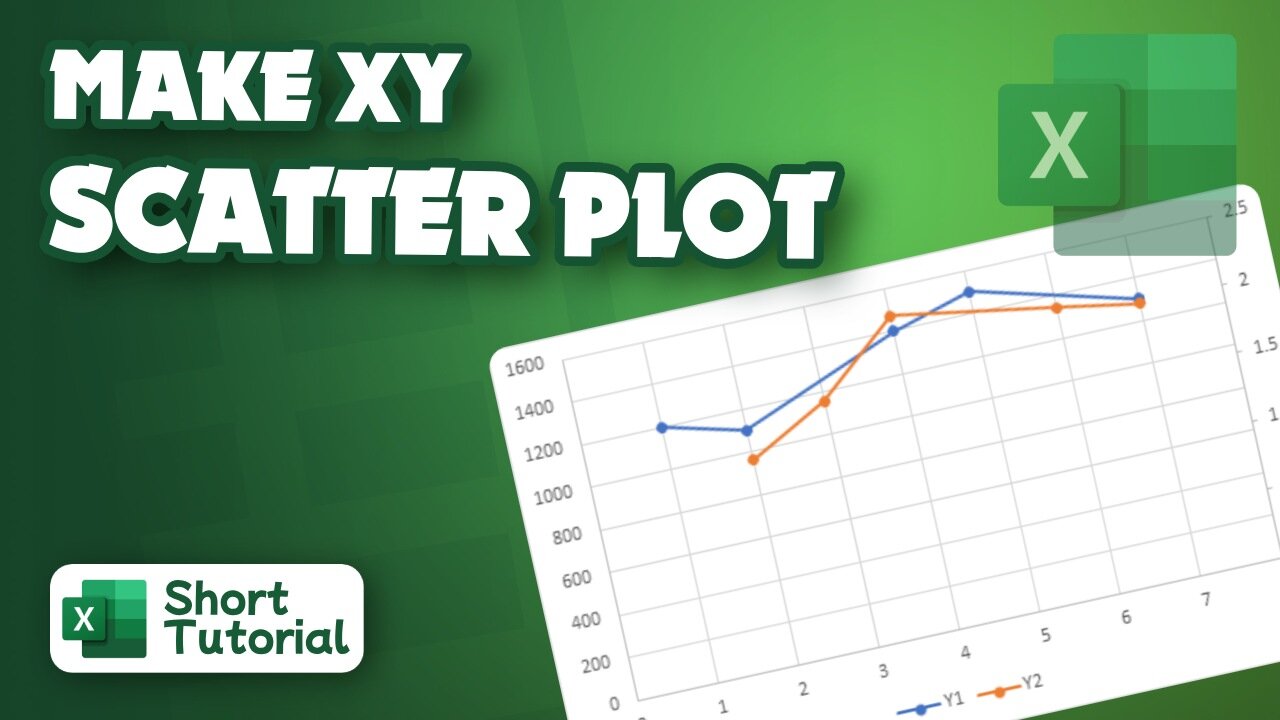
Here,s How to make an XY scatter plot in Excel :
~~~~~~~~~~~~~~~~~~~~~~~~~~~~~~~~~~~~~~~~~~
Step 1: Select the data you want to plot in the chart.
Step 2: Click the Insert tab, and then click X Y Scatter, and under Scatter, pick a chart.
Step 3: With the chart selected, click the Chart Design tab to do any of the following: Click Add Chart Element to modify details like the title, labels, and legend.
Chapters:
0:00 Introduction
0:13 Make XY scatter plot in Excel
2:47 Happy Ending
Thank you Everyone for watching. If this video can help you, don't forget to like & subscribe to my channel.
#initial #solution #make #XY #scatter #plot #in #Excel
-
 1:07:53
Sean Unpaved
1 hour agoRankings, Recaps, & Deadline Deals: CFB Shake-Ups & NFL Trades
22.2K -
 2:13:33
Side Scrollers Podcast
3 hours agoAsmongold SUED for Emotional Distress + Hasan REJECTED+ INSANE Plane Crash + More | Side Scrollers
26.4K6 -
 1:00:32
VINCE
6 hours agoNYC Has Been Seized By The Communists | Episode 162 - 11/05/25
230K343 -
 1:47:26
LadyDesireeMusic
3 hours agoLive Piano & Convo Rumble Rants/ Subs to Request
19.4K2 -

SOLTEKGG
5 hours agoGOING FOR KILL RECORD - BF6 SKIN Giveaway
15.5K1 -
 1:04:48
The Rubin Report
4 hours agoCharlie Kirk’s Warning for MAGA if Mamdani Won
46.8K149 -
 1:33:32
Graham Allen
6 hours agoTold You The War Was FAR From Over… The Blue Wave Just Proved It! Evil Is Fighting Back!
128K109 -
 2:54:17
Badlands Media
12 hours agoBadlands Daily: November 5, 2025 – Election Illusions, Filibuster Fallout & The Deep State’s Next Move
115K19 -
 3:01:00
Wendy Bell Radio
10 hours agoLike Sheep To Slaughter
138K126 -
 1:13:30
DML
6 hours agoDML LIVE: NYC Goes Socialist: Mamdani’s Victory
86.6K41