Premium Only Content
This video is only available to Rumble Premium subscribers. Subscribe to
enjoy exclusive content and ad-free viewing.

official SAT Test No10 Section 4 (Best fit line - Regression Line - Estimation Line)
1 year ago
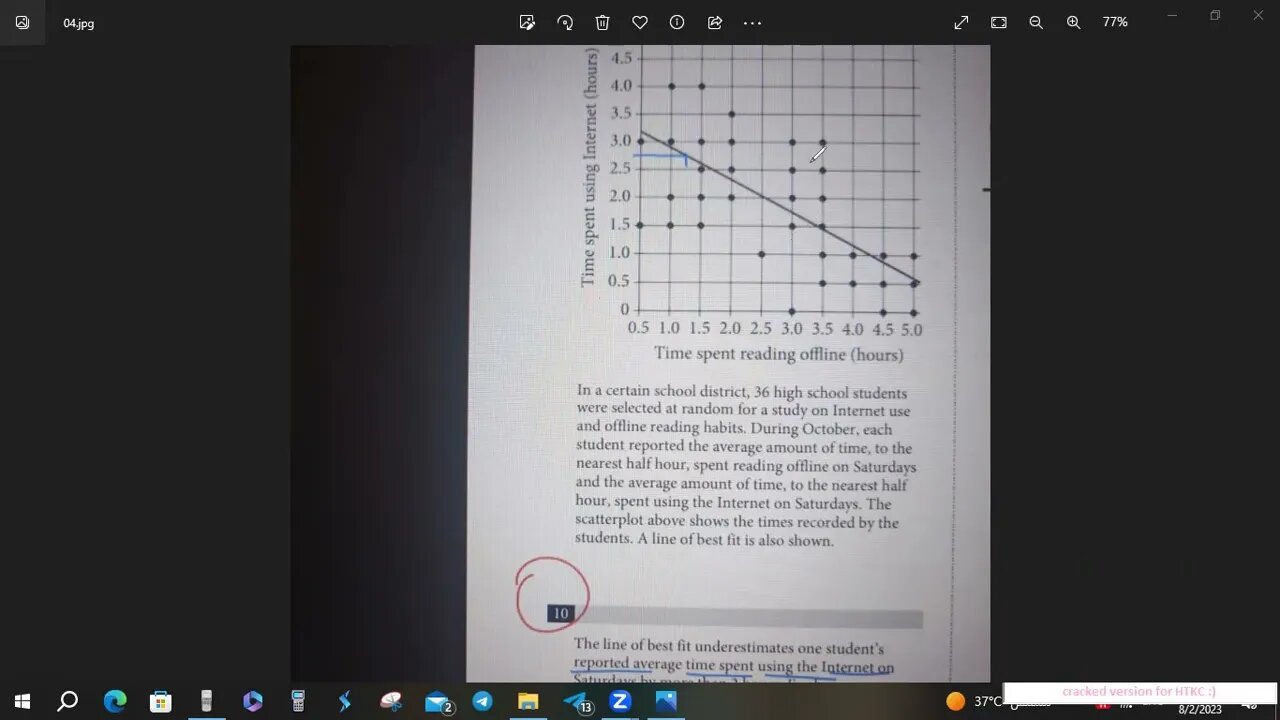
Questions 10 and 11 refer to the following information.
In a certain school district 36 high school students
were selected at random for a study on Internet
and line reading habits. During October* each
student reported the average amount of time, to the
nearest halt hour, spent reading offline on Saturdays
and the average amount of time* to the nearest halt
hour, spent using the Internet on Saturday s The
scatter plot above shows the times recorded by the
students. A line of best fit is also shown.
10) The line of best fit underestimates one student s :
reported average time spent using the internet on
Saturdays by more than 2 hours. For how many
hours did this student report reading offline?
Loading comments...
-
 14:17
14:17
Doc Rich
5 days agoLefties Losing It Once Again
31K35 -
 25:31
25:31
Liberty Hangout
1 day agoMAGA Crashes Pathetic Anti-ICE Rally
103K56 -
 2:02:26
Inverted World Live
10 hours agoUS Soldiers Saw Non-Humans in Suffolk, The Rendlesham Forest Incident | Ep. 80
153K24 -
 6:42:47
Akademiks
11 hours agoICE MAN EPISODE 2 tonight. NEW NBA YOUNGBOY 'MASA' TONIGHT. BIG AKADEMIKS #2 MEDIA PERSONALITY 2025.
98.3K5 -
 2:59:28
TimcastIRL
11 hours agoSouth Park Runs FULL FRONTAL Of Trump In Gross Parody After $1.5B Paramount Deal | Timcast IRL
279K215 -
 4:11:58
The Quartering
10 hours agoOn To The Big Bosses! Act 2 Of Expedition 33
61.6K9 -
 1:24:56
Glenn Greenwald
13 hours agoGlenn Takes Your Questions on Tulsi's Russiagate Revelations, Columbia's $200M Settlement, and More | SYSTEM UPDATE #492
149K96 -
 2:11:56
megimu32
10 hours agoOTS: With Great Power: Every Spider-Man Movie Unmasked w/ @thisistheraygaming
50.1K4 -
 2:38:48
WickedVirtue
9 hours agoSailing w/ The Crew
48.6K2 -
 4:29:37
Meisters of Madness
12 hours agoThe Finals with Redd
50.1K2