official SAT Test No 09 Section 4 (Statistics Problem -Mean- Median)
11 months ago
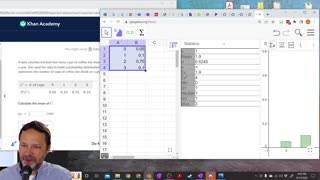
The list shown gives the heights, in inches, for the 6
ten-year-old children in a group.
52, 53, 54, 54, 55, 56
A seventh child with a height of 60 inches will be
added to the group. Which of the following
correctly describes how the mean and the median
of the group will change when the seventh child is added?
Loading comments...
-
 3:19
3:19
Practice Math with Caveman Chang
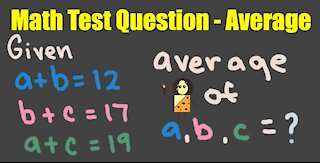
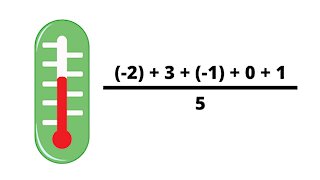
2 years agoMath Test Question on Averages
21 -
 2:44
2:44
GRE Practice
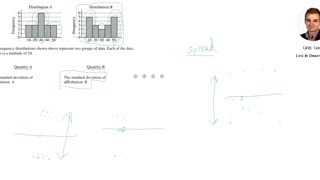
3 years agoStandard Deviation: Practice GRE with a Cambridge PhD
9 -
 3:14
3:14
GRE Practice
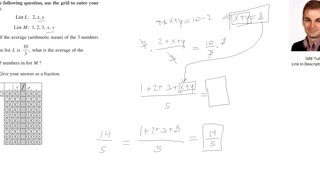
3 years agoUnderstanding Averages: Practice GRE with a Cambridge PhD
33 -
 4:53
4:53
IntoMath Grade 8 Lessons
3 years ago $0.08 earnedMean - Pie Graph - Bar Graph - IntoMath
302 -
 34:46
34:46
Jsefantiri
11 months agoGCSE MATHEMATICS - AVERAGES( MEAN, MEDIAN, MODE AND RANGE) AND INTERPRETATIONS.
271 -
 0:25
0:25
djae1991
2 years agoMean median mode statistics
11 -
 4:52
4:52
Help Me Rhonda
1 year agoWhat does finding yourself mean?
4 -
 5:09
5:09
MrPowers4Math
1 year ago $0.43 earnedUsing GeoGebra to find Means and Medians
123 -
 0:25
0:25
djae1991
2 years agomean median mode review
2 -
 4:20
4:20
Restored Republic
1 year agoMath and Reading Scores Nosedive for American Teens After Disastrous COVID Policies
9551