Premium Only Content
This video is only available to Rumble Premium subscribers. Subscribe to
enjoy exclusive content and ad-free viewing.

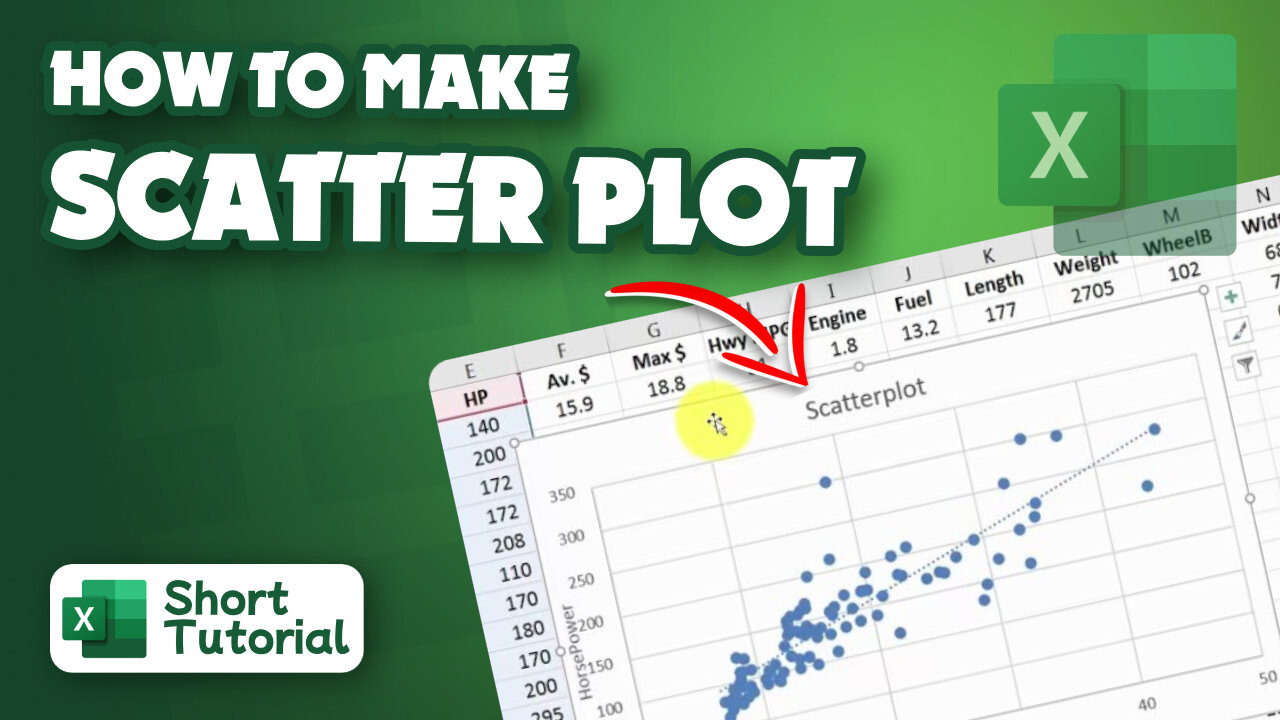
How to make scatter plot in excel
2 years ago
3
Hello, My Dear Friends, !! In this video, I will show you How to make a scatter plot in Excel. Watch the video till the end Thanks.
Guys, Here you will know about the guideline on How to make a scatter plot in Excel:
~~~~~~~~~~~~~~~~~~~~~~~~~~~~~~~~~~~~~~~~~
Step 1: Choose the time column and the data series column.
Step 2: Then, click on the Insert ribbon.
Step 3: Choose Scatter.
Step 4: Pick a Scatter with Smooth Lines from the scatter plot options.
Chapters:
~~~~~~~~~~~~~
0:00 Introduction
0:13 Go to the Excel sheet
0:24 Make scatter plot in Excel
2:08 GoodBye!
Thank you Everyone for watching. If this video can help you, don't forget to like & subscribe to my channel.
#initial #solution #make #scatter #plot #in #excel
Loading comments...
-
 2:04:30
Side Scrollers Podcast
16 hours agoGold’s Gym CONTROVERSY & BOYCOTT + Craig ADMITS DEFEAT + More | Side Scrollers
4.97K7 -
 1:26:06
MattMorseTV
15 hours ago $0.04 earned🔴Trump's Press Conference MASSIVE UPDATE.🔴
8.22K44 -
 21:39
21:39
Nikko Ortiz
3 days agoI Take A North Korean Shooting
42.8K8 -
 LIVE
LIVE
Lofi Girl
3 years agolofi hip hop radio 📚 - beats to relax/study to
224 watching -
 2:14:13
FreshandFit
13 hours agoShe Was Given Extravagant Gifts And STILL Friendzoned Him +EXPOSED
167K31 -
 1:16:07
Man in America
10 hours agoOperation Gladio: The CIA, Mossad & City of London’s Plan for a New World Order
22.1K24 -
 2:11:41
Badlands Media
12 hours agoDEFCON ZERQ Ep. 016: Shadow Governments, Ancient Tech & the Spiritual War for Humanity
76.1K58 -
 2:09:24
Inverted World Live
7 hours agoRats Have Learned to Hunt Bats | Ep. 135
28.3K9 -
 2:48:01
TimcastIRL
7 hours agoLIVE Election Coverage: Polling Stations SWATTED, Bomb Threats Called In | Timcast IRL
245K174 -
 3:30:07
Barry Cunningham
7 hours agoBREAKING NEWS: COUNTDOWN TO COMMUNISM! ELECTION RESULTS SHOW!
54.7K44