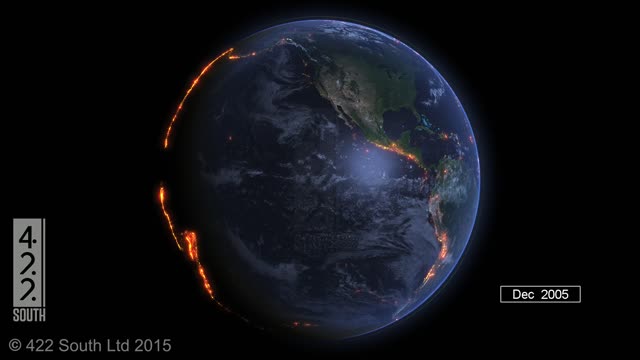
Visualization shows global earthquakes from the year 2000 - 2015
Loading 1 comment...
-
 2:59
2:59
SWNS
5 years agoMesmerising footage shows starling flock flying
1.58K1 -
 1:12
1:12
ViralHog
5 years ago $4.01 earnedBeautiful Sand Art from Sénégal
26.3K1 -
 0:57
0:57
SWNS
6 years agoArtists shows off hypnotic string installations
38 -
 0:35
0:35
rumblestaff
5 years agoJaw-dropping footage shows Comet NEOWISE from space station
6.57K10 -
 1:25
1:25
Just the News
5 years agoData from Massachusetts shows death rate continues to fall
41.5K -
 1:42
1:42
WEWS
5 years agoStudy shows difference between dying with, dying from COVID-19
143 -
 1:39
1:39
WXYZ
5 years agoReceding water shows damage from mid-Michigan flood
16 -
 2:47
2:47
WEWS
4 years agoBodycam shows Twinsburg police officers rescue trapped children from overturned vehicle
2931 -
 2:20
2:20
NowYouKnowEnglish
5 years agoWhy Do Earthquakes Happen? *
14 -
 LIVE
LIVE
Barry Cunningham
3 hours agoPRESIDENT TRUMP IS THE TROLLER-IN-CHIEF AND MORE BREAKING NEWS!
2,984 watching